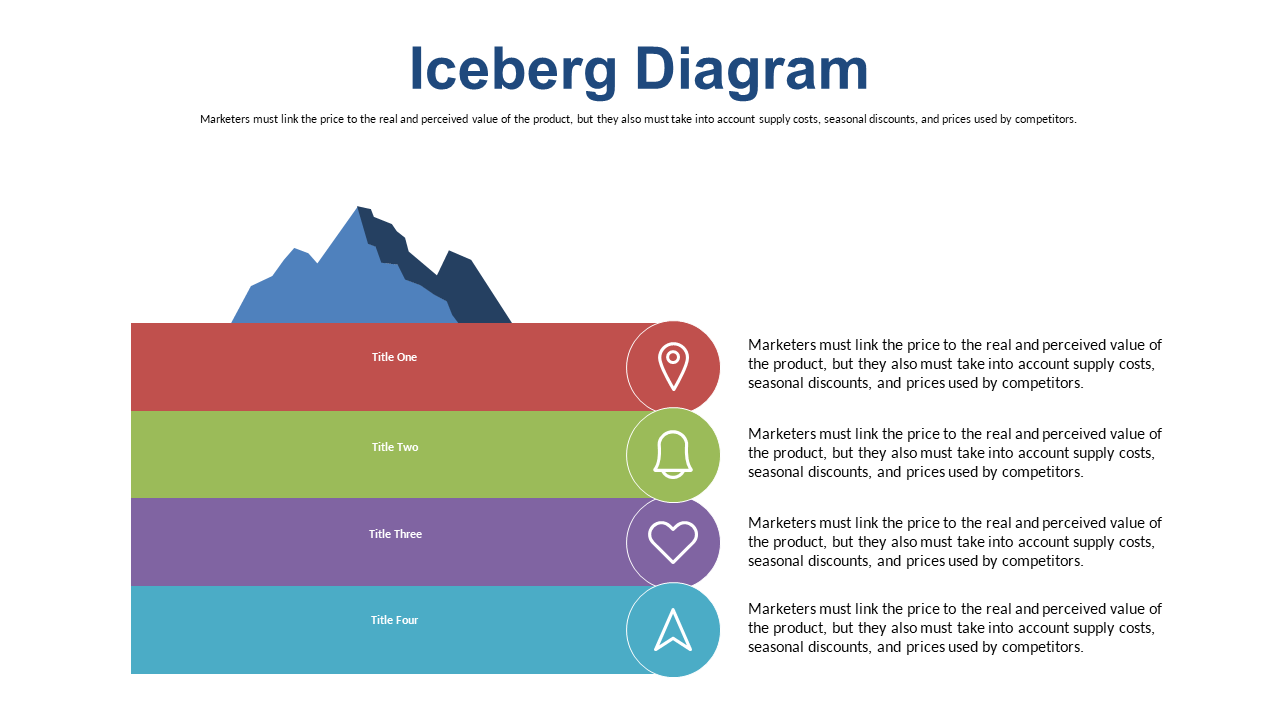
Highlight Value Differences with Iceberg Diagram
Product Description
When trying to communicate complex ideas, capturing and maintaining your audience’s attention is crucial. The Iceberg Diagram not only simplifies the concept of value differences but also visually engages your listeners, ensuring they grasp the critical insights you want to share.
This slide is perfect for consultants presenting findings to clients, business analysts discussing market trends, or educators teaching complex economic concepts. You might use it in strategy meetings or workshops aimed at aligning team understanding around product value, making sure everyone is on the same page.
Available for just $0.99, this slide is ready for instant download and can be easily edited in both PowerPoint and Google Slides. In minutes, you’ll be able to customize it to suit your specific message and style.
$0.99 – Purchase Checkout
Added to cart