Visualize Yearly Housing Trends in PowerPoint
Product Description
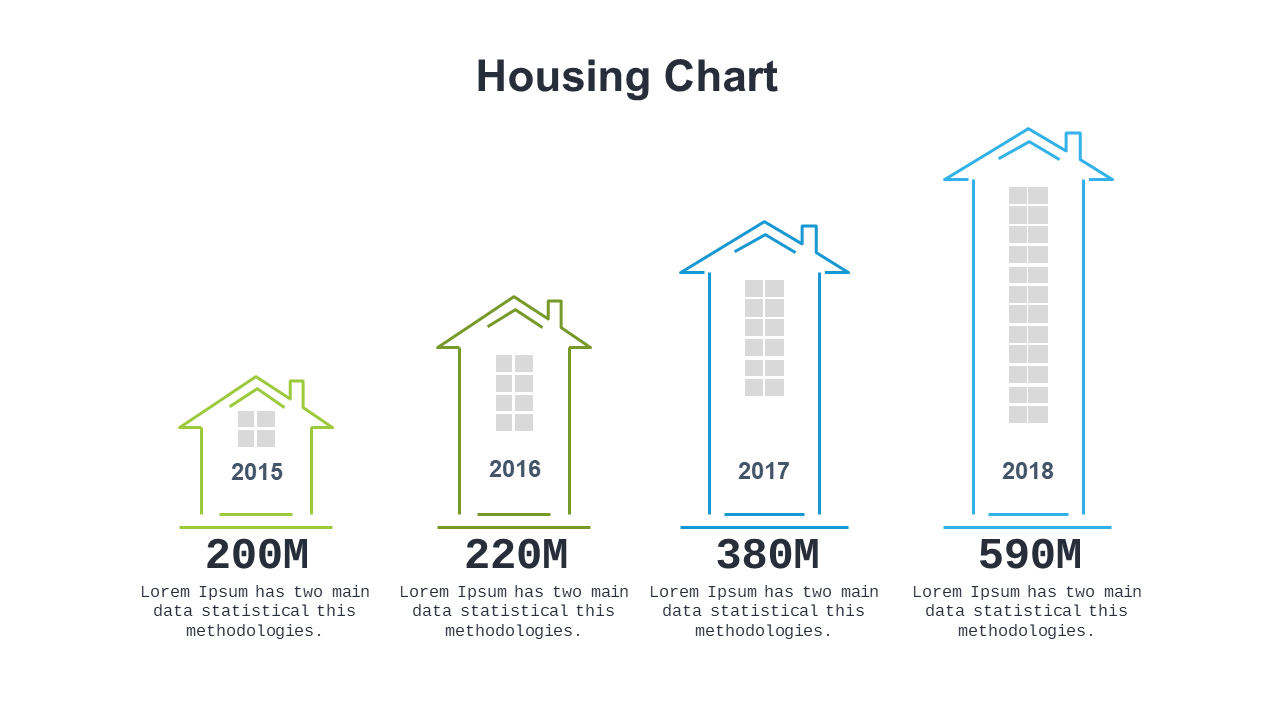
Illustrating yearly housing trends effectively can be a daunting task, especially when you need to grab attention quickly. This slide provides a clean and clear chart that helps convey critical insights at a glance, making it easier for your audience to understand essential market dynamics.
Real estate analysts, financial advisors, and property managers will find this slide particularly useful in discussions about market performance and investment opportunities. It’s the perfect tool for quarterly reports, investor briefings, or educational sessions focused on housing trends.
Available for just $0.99, this slide can be downloaded immediately and is fully editable in PowerPoint and Google Slides. You’ll be able to customize it to fit your data needs quickly, ensuring your presentation is impactful without the hassle.
$0.99 – Purchase Checkout
Added to cart