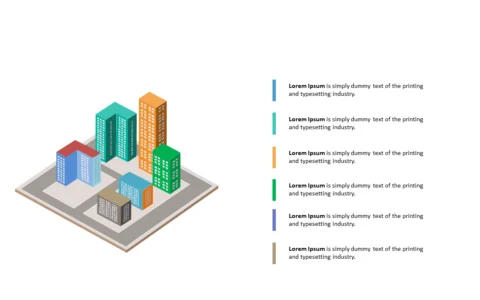
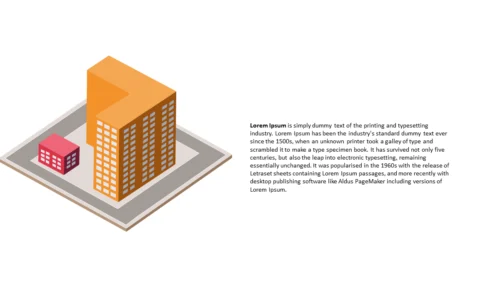
Isometric House Illustration for Real Estate Presentations
Product Description
When trying to communicate the nuances of real estate properties, presentations can easily become stale and uninspiring. You want to capture your audience’s attention and convey complex information clearly and effectively.
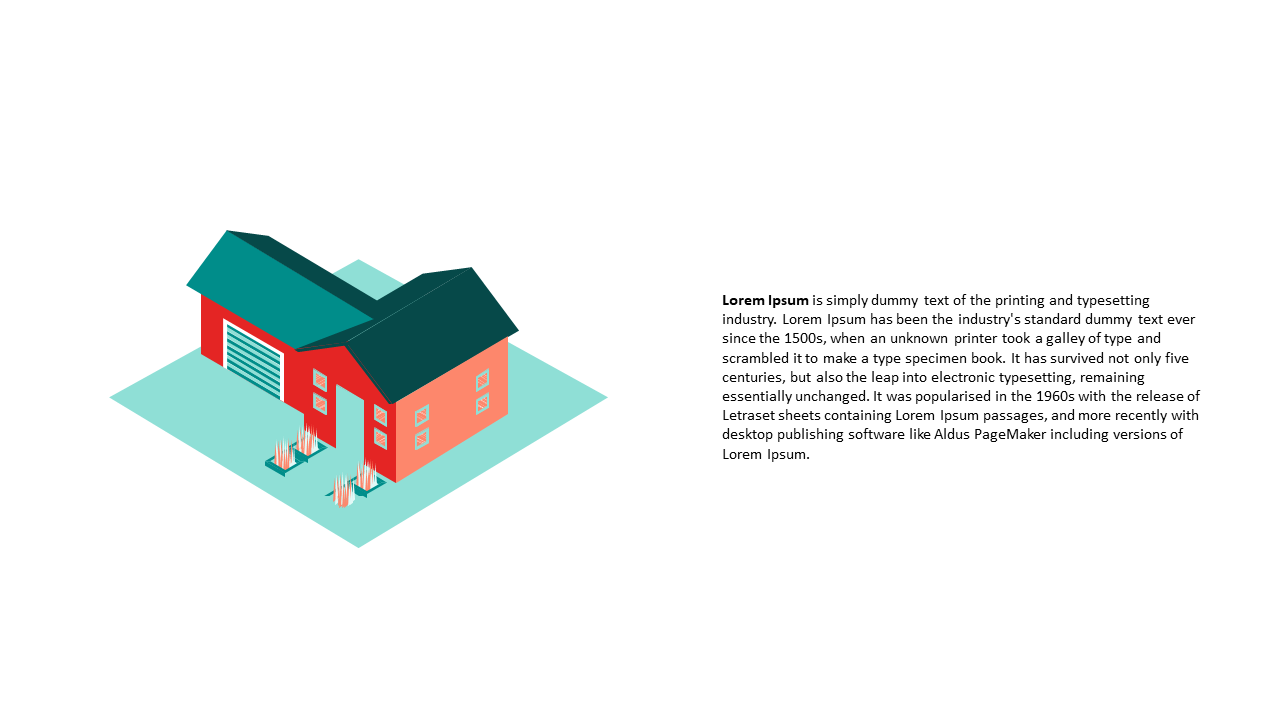
This detailed isometric illustration will help you do just that, making your ideas come to life and resonate. This slide is ideal for real estate agents, property developers, and investors during pitch meetings or investor presentations. It adds a level of professionalism and creativity that can really differentiate you from the competition, helping to keep your audience engaged and informed.
For just $0.99, this slide is ready for instant download and can be edited in PowerPoint or Google Slides. You can quickly tailor it to your specifications and have an engaging presentation prepared in no time.
$0.99 – Purchase Checkout
Added to cart