Visualize Research Steps with Horizontal Indicators
Product Description
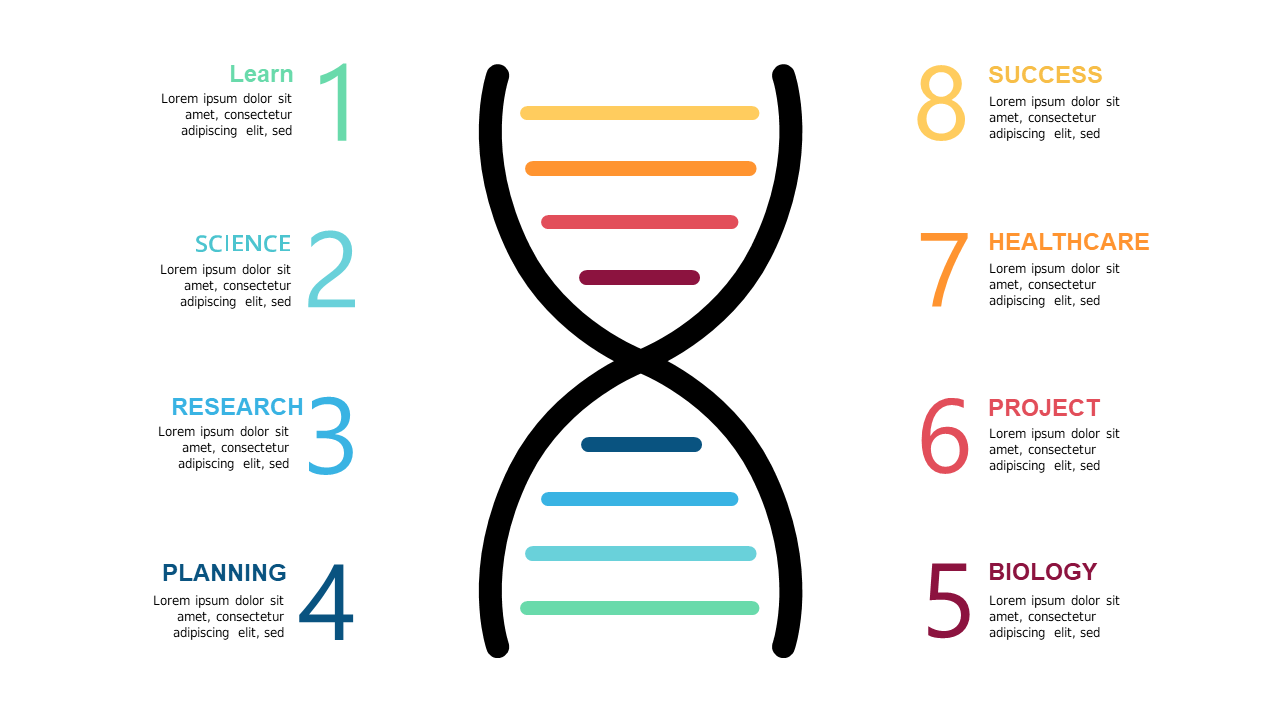
Clearly outlining research steps is vital for ensuring that all team members understand project timelines and expectations. This horizontal indicator slide helps you visualize each phase, reducing the chances of miscommunication and keeping everyone aligned on the project’s goals.
Project managers and researchers will find this slide invaluable during team briefings to clarify upcoming steps. Academic presenters can use it to guide their audience through the research process, while business analysts might employ it to display stages in market research projects. It’s a straightforward way to enhance your presentations.
Available for just $0.99, this slide is ready for immediate download and is fully editable in PowerPoint and Google Slides. Customize it to fit your project’s specific needs and start delivering clear, concise presentations in minutes.
$0.99 – Purchase Checkout
Added to cart







