Showcase Workflows with Horizontal Process Chart
Product Description
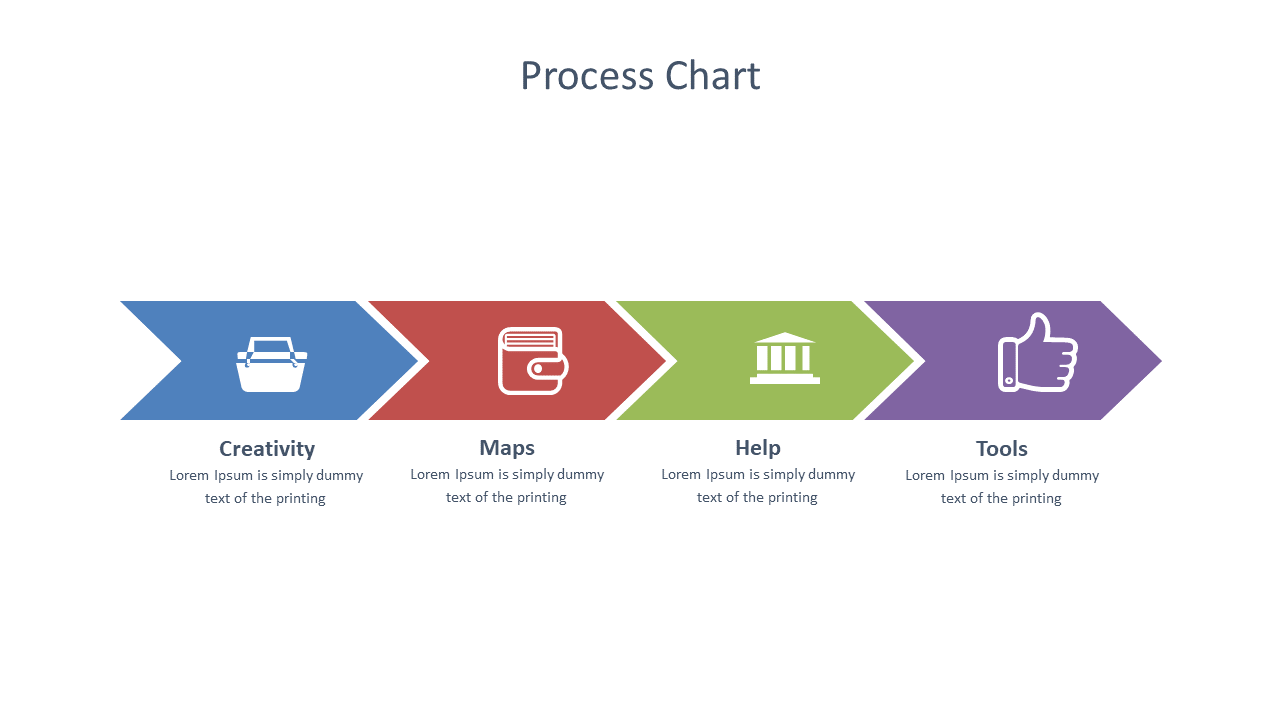
Keeping your team aligned on complex workflows can be a real struggle, especially when every detail matters. This horizontal process chart simplifies the narrative, allowing your audience to grasp the sequence of events at a glance with its colorful arrows and intuitive icons.
You’ll find that clarity leads to better discussions and decision-making. Great for project managers coordinating cross-functional teams, this slide is perfect for software development meetings, marketing strategy sessions, or even operational reviews. Anytime you need to illustrate how different tasks fit together, this horizontal process chart will help your colleagues keep track of where they are and what comes next.
At just $0.99, this slide is an easy addition to your presentation toolkit. You can download it instantly, and it’s fully editable in both PowerPoint and Google Slides, making customization a breeze.
$0.99 – Purchase Checkout
Added to cart







