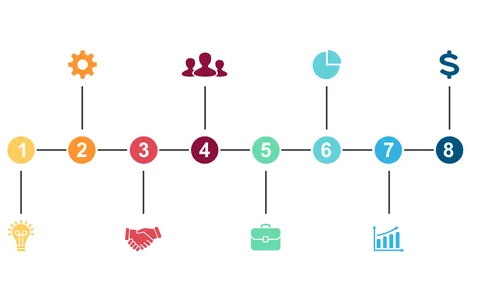
Engage Audiences with Horizontal Chart V6
Product Description
Complex data can easily overwhelm your audience, leading to confusion instead of engagement. You need a way to simplify your message and keep your viewers interested. This horizontal chart slide provides a colorful and clear representation of sequential processes that makes it easier for your audience to follow along.
This slide is perfect for project managers during progress update meetings or marketing professionals presenting campaign flows. Whether you’re outlining a product development cycle or explaining a customer journey, this slide helps you convey your message with clarity and style.
For just $0.99, you can download this slide and make it your own in minutes. It’s easy to edit in PowerPoint or Google Slides, so
you can customize it to fit your specific needs right away.
$0.99 – Purchase Checkout
Added to cart