Visualize Sequential Steps with Horizontal Chart V19
Product Description
Many professionals struggle with presenting step-by-step processes in a way that’s easy for their audience to follow. Clarity is essential, especially when presenting ideas to teams or clients who may not be familiar with the intricacies.
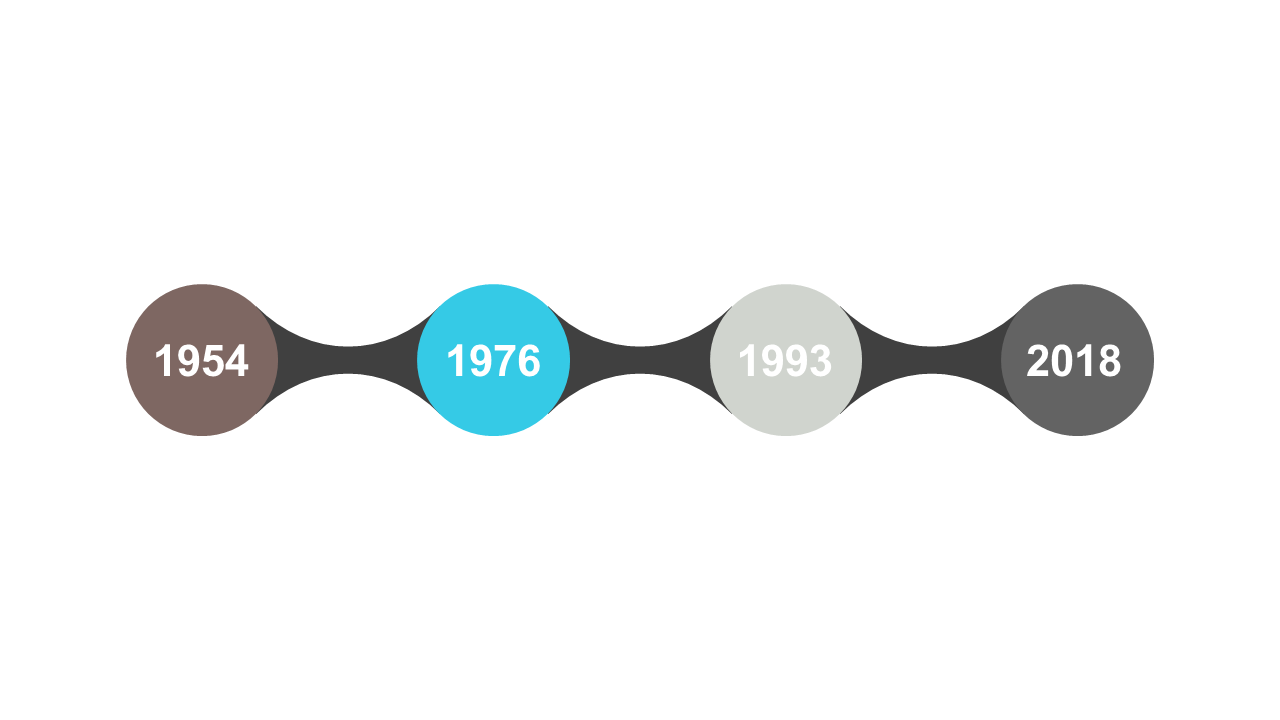
This horizontal chart slide helps you break down your information clearly and visually. This slide is perfect for educators creating lesson plans, operations managers outlining procedures, or any role that involves presenting sequential data. The clean design works well across various industries where step-by-step clarity is crucial for understanding.
For just $0.99, you can download this slide instantly, and it’s easily editable in both PowerPoint and Google Slides. Start making your presentations clearer today.
$0.99 – Purchase Checkout
Added to cart







