Visualize Workflows with Horizontal Chart V16
Product Description
Conveying complex workflows can feel overwhelming, especially when team members are confused about the steps involved. Miscommunication can lead to delays and frustration, so having a clear visual representation is essential.
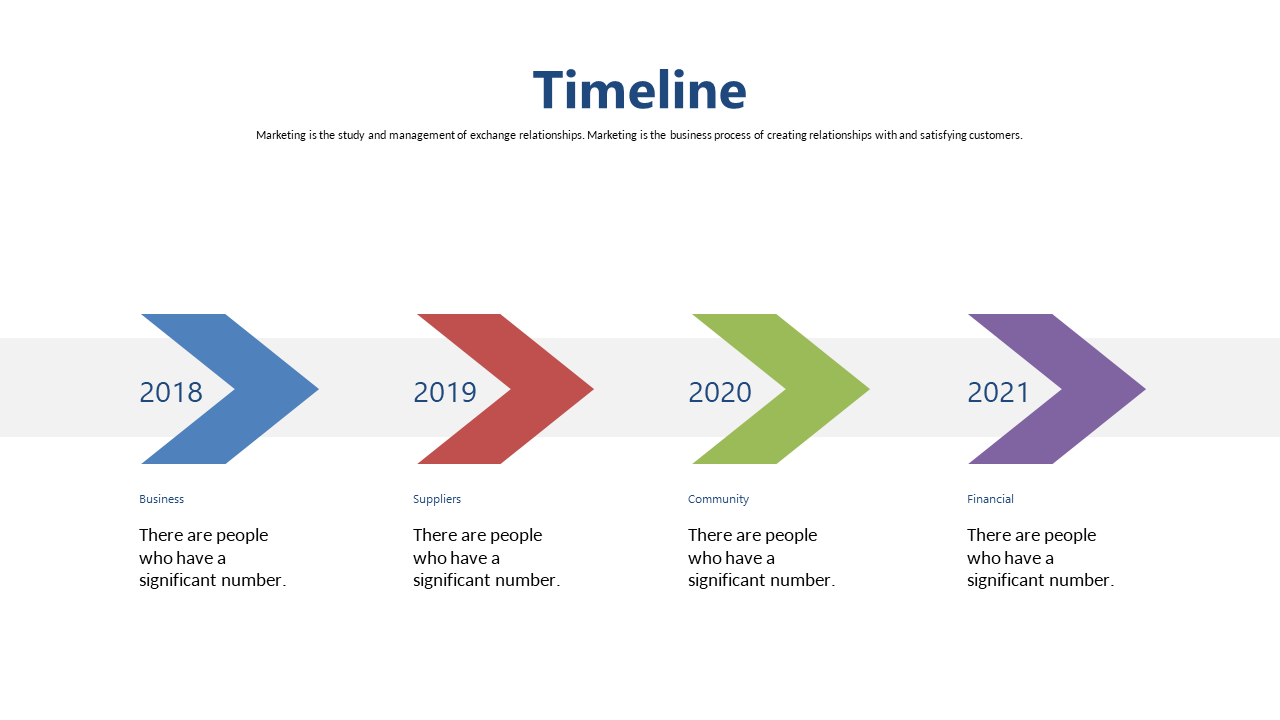
This slide helps you break down intricate processes into an engaging format that everyone can understand. This horizontal chart is ideal for project managers, team leaders, or any professional in the tech or consulting industries who needs to present workflows during kick-off meetings or strategy sessions. Whether you’re updating your team during a sprint review or explaining a new process to new hires, this visual aid will keep everyone on the same page.
For just $0.99, you get an instant download that’s ready for editing in PowerPoint and Google Slides. Customize it to fit your specific needs and start presenting with clarity in just minutes.
$0.99 – Purchase Checkout
Added to cart







