Present Processes with Horizontal Chart V13
Product Description
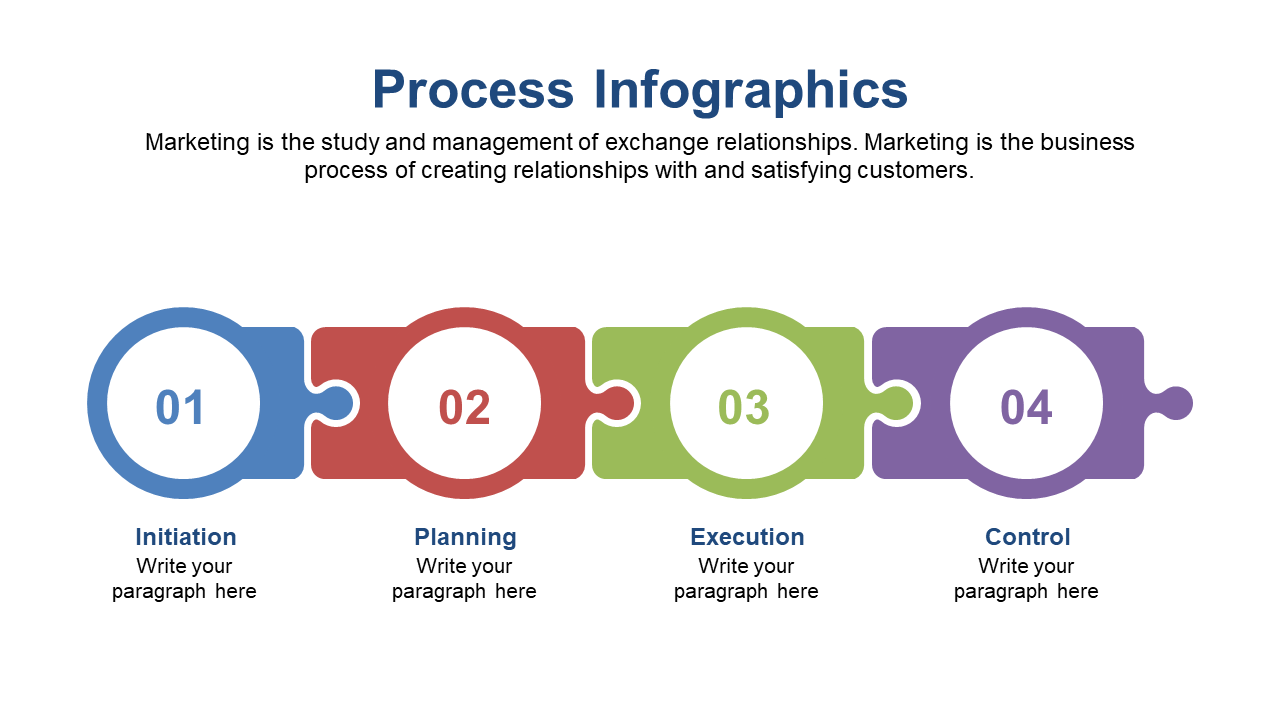
Delivering clear visuals under tight deadlines can be daunting, especially when you’re navigating complex processes. This horizontal chart simplifies your task, offering a clean and concise way to present each step visually. It’s designed to enhance comprehension and keep your audience focused on the critical aspects of your workflow.
This slide is a great fit for team leads conducting project updates or consultants presenting strategic recommendations. Whether you’re in a performance review or a project kickoff meeting, this chart can help communicate your ideas more effectively.
The vibrant colors and icons make complex concepts easier to digest. You can grab this slide for just $0.99, and it’s an instant download that you can easily edit in PowerPoint and Google Slides. Get your presentation ready in minutes and focus on delivering your message with confidence.
$0.99 – Purchase Checkout
Added to cart







