Horizontal Gantt Chart for Project Scheduling
Product Description
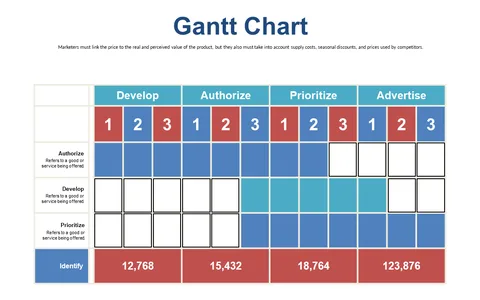
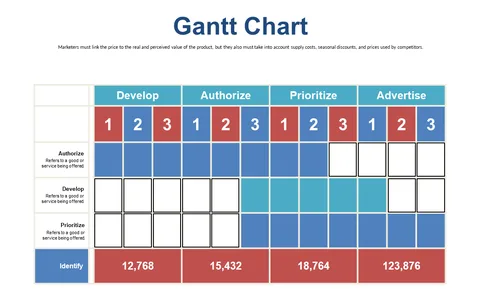
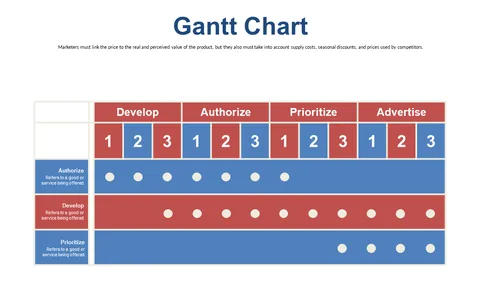
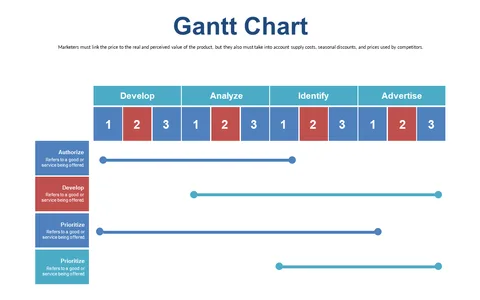
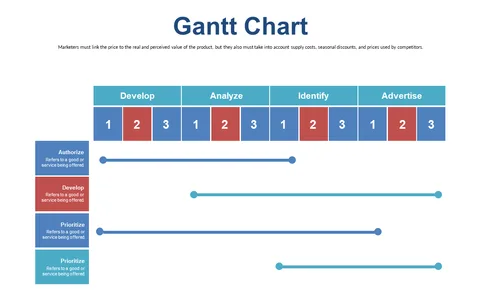
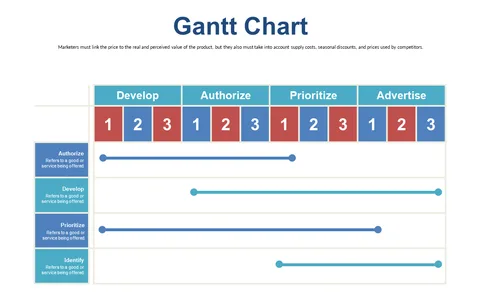
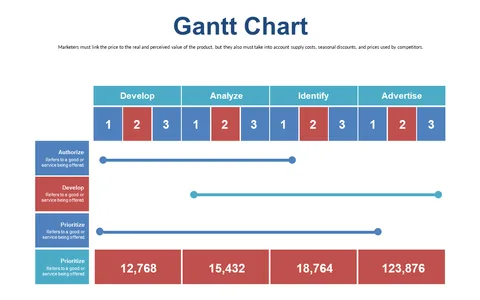
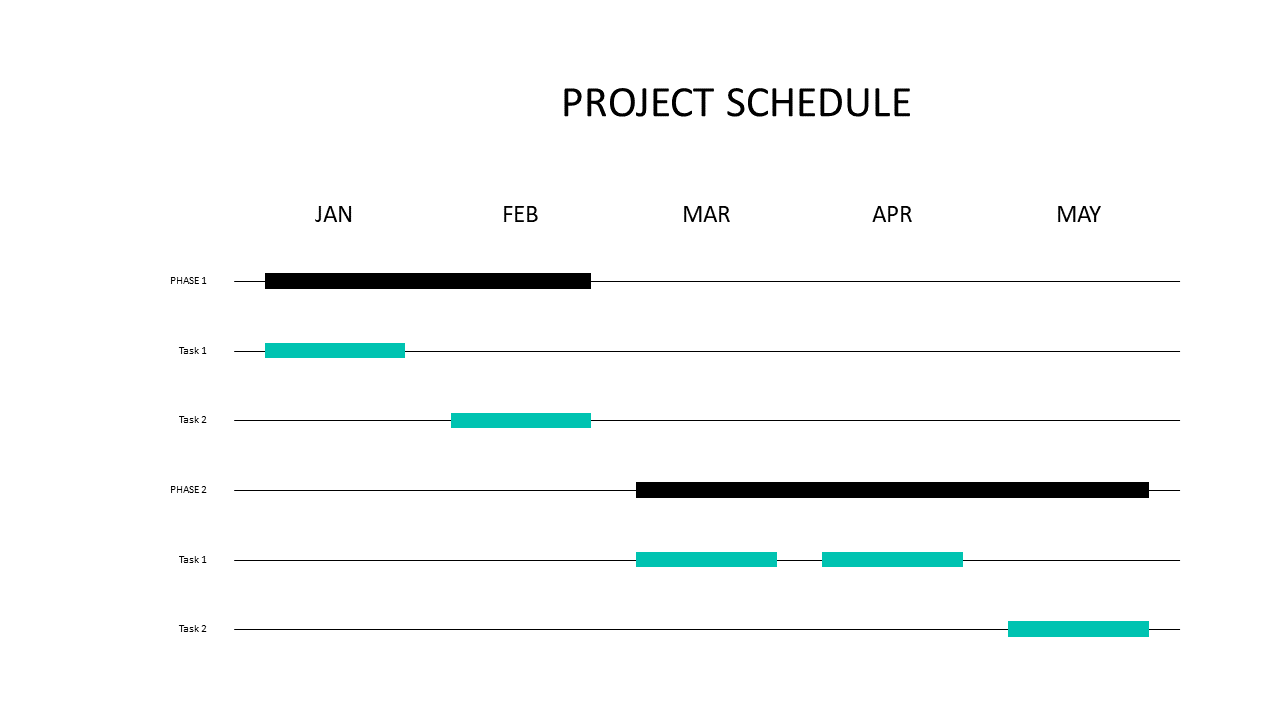
Managing multiple project timelines can be a real headache, especially when you’re juggling deadlines across various tasks. This horizontal Gantt chart makes it easy to visualize your project’s schedule, ensuring that nothing slips through the cracks as you progress.
With clear sections and customizable elements, you can tailor it to fit your specific needs. This slide is perfect for project managers in industries like construction, software development, or marketing, where tracking various tasks is essential. As you lead team meetings or client updates, having a clear representation of your project timeline will help you communicate progress and make informed decisions quickly.
At just $0.99, this slide is an instant download and is fully editable in both PowerPoint and Google Slides. Get organized in minutes and keep your projects on track with ease.
$0.99 – Purchase Checkout
Added to cart