Showcase Global Presence with Percentage Map

Product Description
Communicating your global reach can feel overwhelming, especially when you need to present diverse market insights. Without a clear visual aid, your audience might struggle to understand the extent of your operations across different regions.
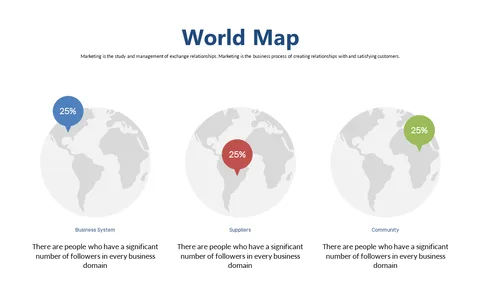
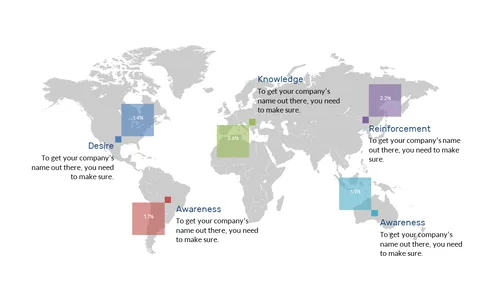
This slide provides a world map with percentage indicators, making it easier to convey your company’s presence worldwide. This slide is perfect for market researchers, sales executives, or business development managers who need to present findings in client meetings or strategy sessions. If you’re a market analyst looking to showcase emerging markets or a sales director wanting to highlight growth areas, this slide will effectively support your narrative.
At just $0.99, this slide is ready for instant download and can be easily edited in PowerPoint and Google Slides. You’ll save time while ensuring your presentation looks professional and polished in minutes.
$0.99 – Purchase Checkout
Added to cart