Highlight Global Presence with Percentage Indicators

Product Description
In a competitive landscape, capturing your global market presence can be a daunting task. Presenting data without a compelling visual can leave your audience disengaged and uninformed.
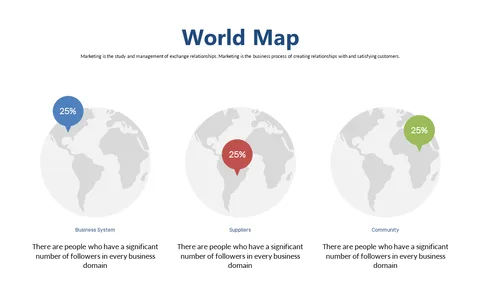
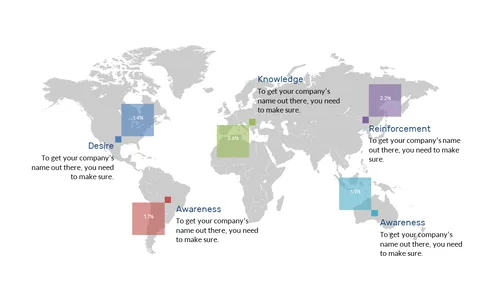
This slide features a world map overlaid with percentage indicators to clearly showcase your company’s global reach and market insights. Ideal for business analysts, marketing managers, or executive leaders preparing for important investor meetings, this slide helps to effectively communicate your global strategy. If you’re responsible for international expansion plans or providing performance updates to senior management, you’ll find this slide invaluable for your presentations.
Available for just $0.99, this slide is an instant download, ready for you to edit in PowerPoint and Google Slides. It takes mere minutes to customize, ensuring your data stands out and resonates with your audience.
$0.99 – Purchase Checkout
Added to cart