Visualize Behavior Change Framework Globally
Product Description
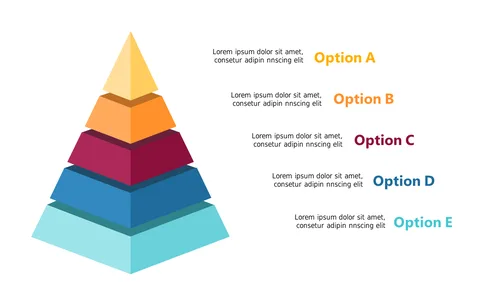
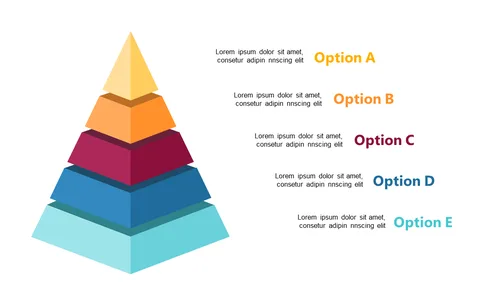
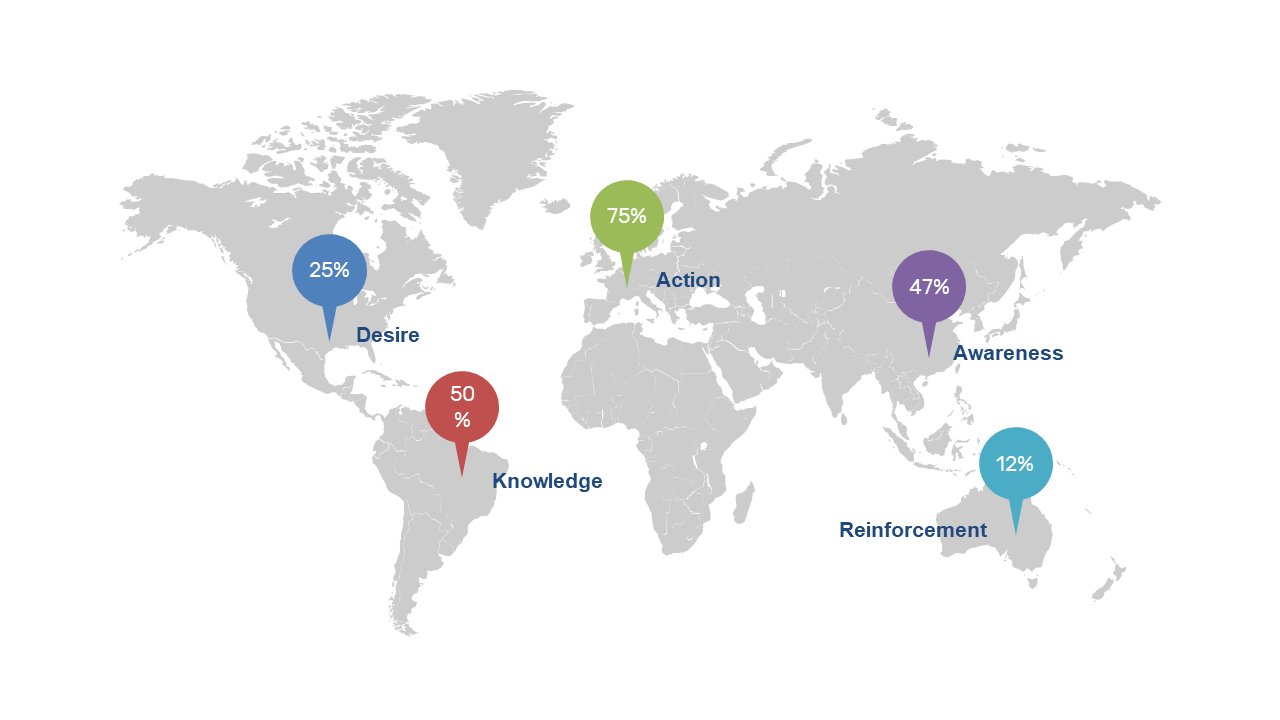
Deciphering behavior change on a global scale can be complex and intimidating. This slide simplifies the task by providing a clear diagram that outlines a comprehensive framework for understanding the nuances of behavior change across various regions, making your communication straightforward.
Behavioral scientists, marketing strategists, and educators can use this slide during presentations, workshops, or training sessions to illustrate the factors that drive behavior change. It’s designed to help your audience grasp intricate ideas easily, no matter their background.
Available for just $0.99, this slide is ready for instant download and can be edited in PowerPoint or Google Slides. Its straightforward design allows you to customize and present your insights in just minutes.
$0.99 – Purchase Checkout
Added to cart