SlideSwift
By Category
💼Business 📊Infographics □Minimal 🕐Timelines ✨Neumorphic 🗑Diagrams 🔄Flow Charts ✨Glassmorphism 🎨Creative 🌍Abstract 🔄Cycle Diagrams 💎Isometric 🖼Illustrations 📱Social Media 🗺MapsBy Slide Type
🚀Pitch Deck 📌Roadmap 🔍SWOT Analysis 📅Timeline 📈Gantt Chart 🏢Org Chart 📋Funnel ⚖Comparison 📄Case Study 📋Agenda ⭐Icons & Lists 👏Thank You
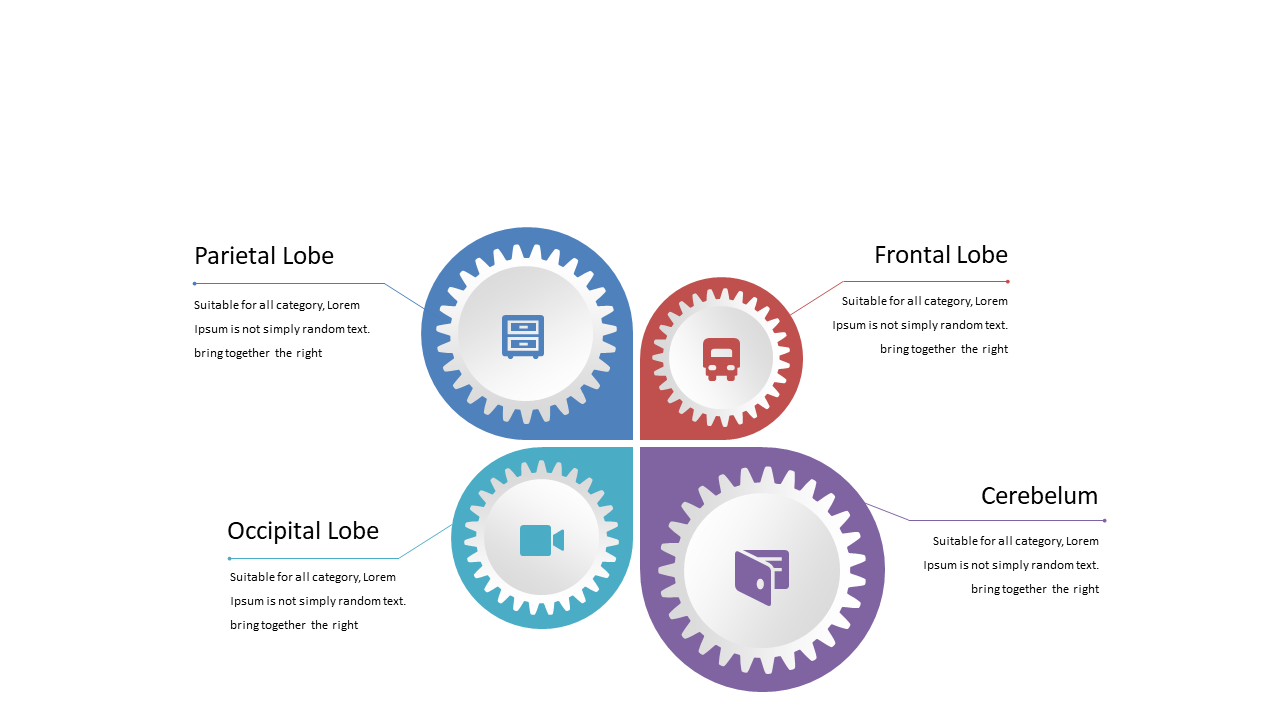
Have you ever struggled to explain intricate concepts in a way that captivates your audience? This engaging slide showcases a diagram of four interconnected gears, each representing crucial brain regions: the Parietal Lobe, Frontal Lobe, Occipital Lobe, and Cerebellum. With its clean design and vibrant colors, this visual aids understanding and makes your presentation memorable. An operations manager can use this slide to explain how different brain functions relate to team dynamics, ensuring everyone grasps the connections. A business analyst could incorporate this diagram to highlight cognitive processes influencing decision-making, making complex data more relatable. For architects, this slide serves as a foundation for discussing how design can impact mental well-being, drawing parallels between brain function and spatial layout. You can easily customize the text and colors to align with your presentation’s theme. $0.99 — add this single slide to any deck from the SlideSwift Slide Library. No subscription needed. Mix slides from any category to build your perfect deck.
Add more from this category to your custom deck