Visualize Project Timelines with Gantt Chart
Product Description
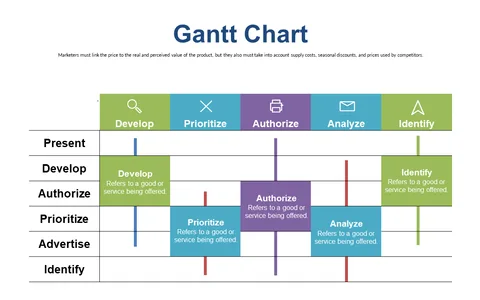
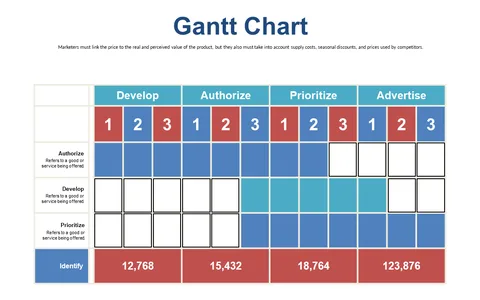
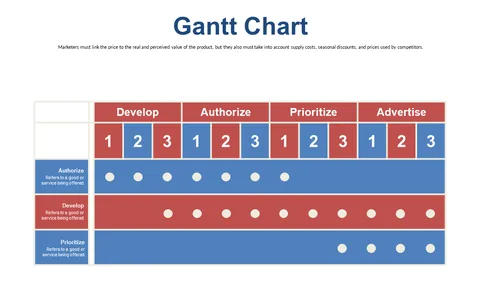
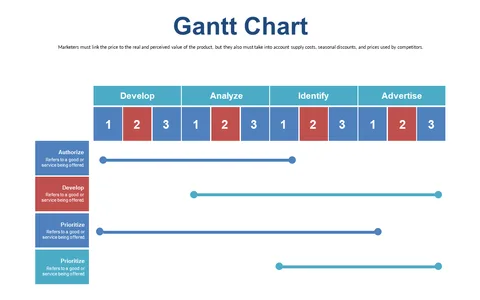
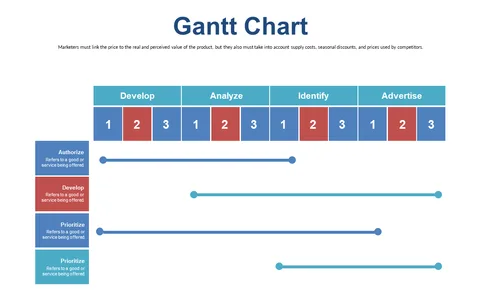
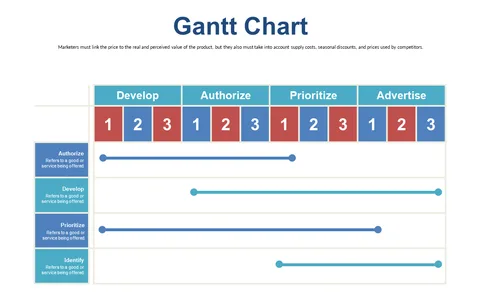
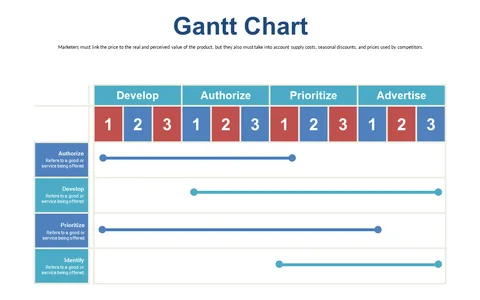
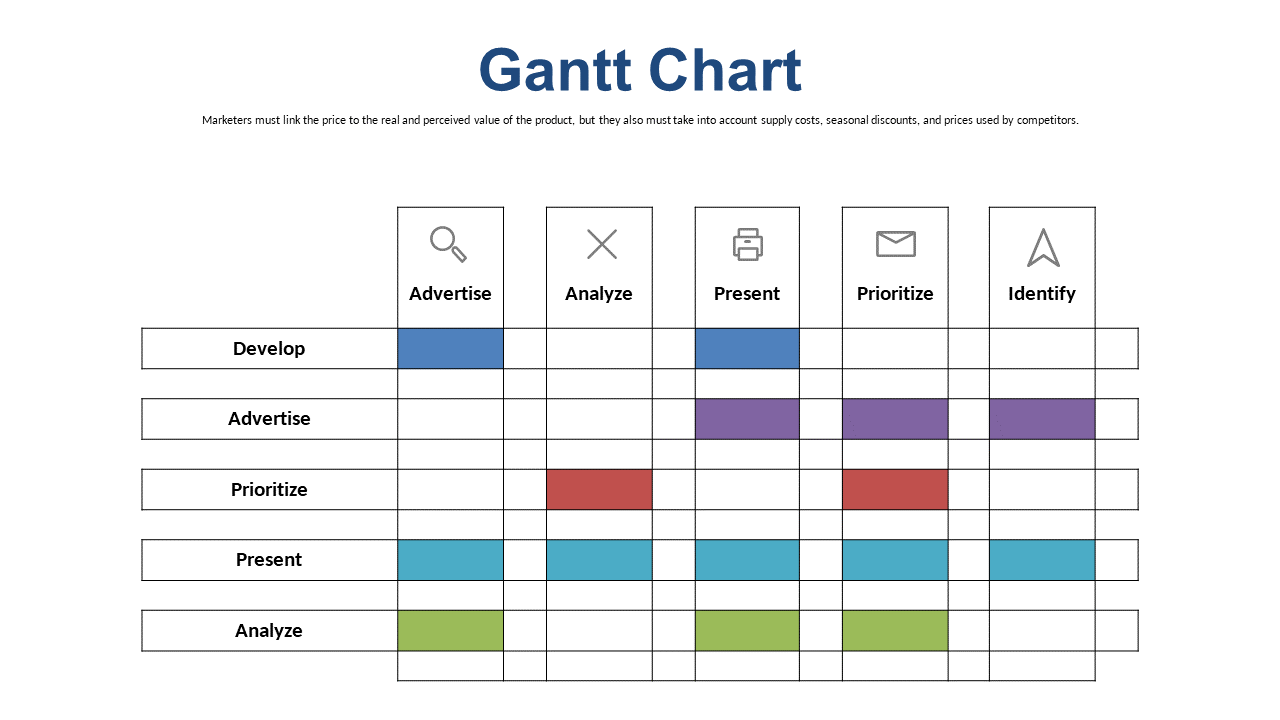
Managing project timelines and tasks can feel overwhelming, particularly when trying to keep everything organized and on track. This Gantt chart slide offers a straightforward visual representation of your project timelines, making it easier for you to illustrate task relationships and prioritization.
Project managers, team leaders, and operations specialists will find this slide invaluable during project kick-offs, status updates, or stakeholder meetings. It’s an ideal way to visually communicate complex timelines and dependencies, ensuring everyone is aligned and informed.
For just $0.99, you can download this Gantt chart slide instantly, ready for editing in PowerPoint or Google Slides. With its intuitive design,
you can customize it in minutes and get your project presentation off to a strong start.
$0.99 – Purchase Checkout
Added to cart