Gantt Chart for Task Prioritization Analysis
Product Description
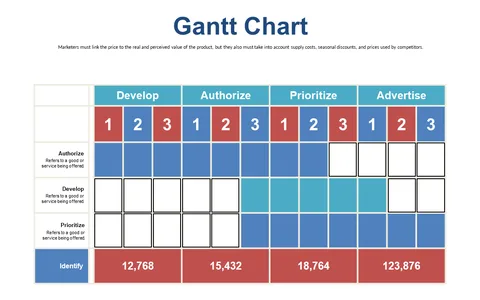
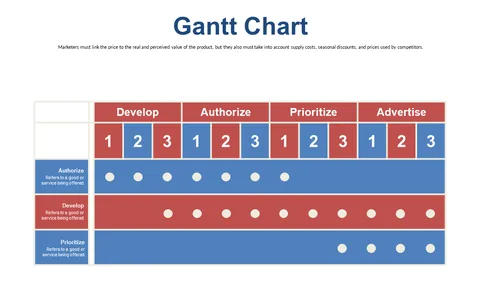
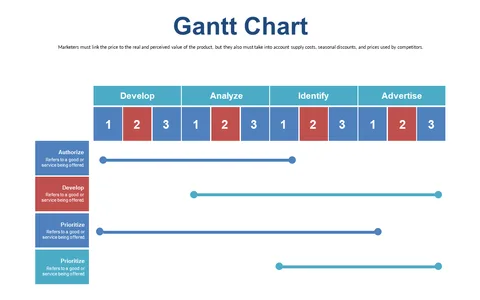
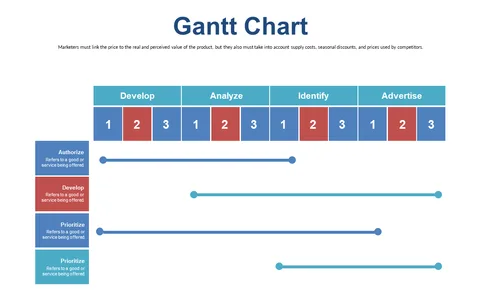
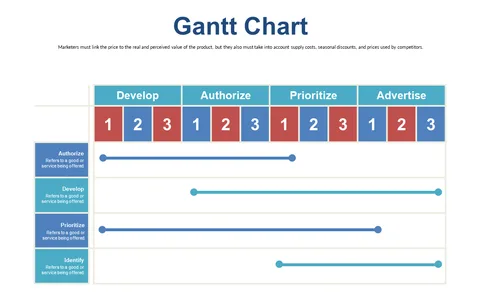
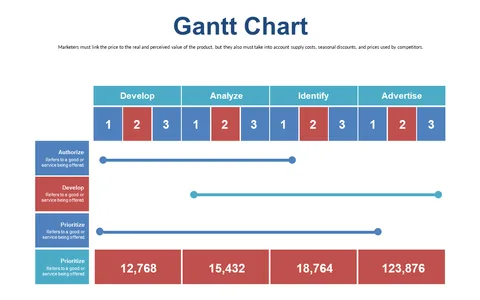
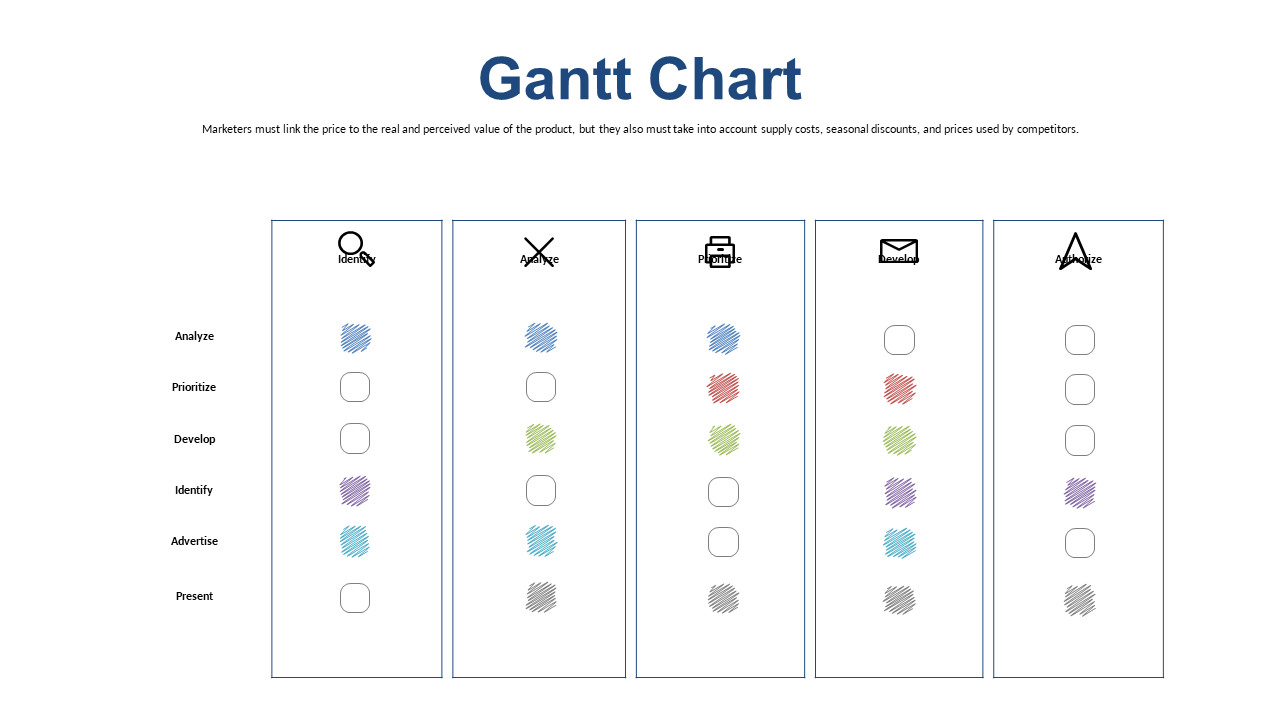
Facing the challenge of prioritizing multiple tasks can be overwhelming for program managers, especially when deadlines loom. This Gantt chart slide helps you visually break down tasks and timelines, making the prioritization process straightforward.
Use this slide in project meetings, team briefings, or when presenting to executives in sectors like marketing or software development. It enables you to clearly communicate project status and ensures your team stays on track.
At just $0.99, you can download this slide instantly and customize it in PowerPoint or Google Slides. You’ll be ready to present in no time!
$0.99 – Purchase Checkout
Added to cart
✅ Instant delivery
✅ Fully editable
✅ PowerPoint & Google Slides
Category:
$0.99
Per slide · No minimum · Pay only for what you pick
✓ $0.99/slide
No minimum order
✓ Mix any category
No subscription
Building a full deck?
Mix slides from any of our 58 categories —
all merged into one PowerPoint.
$0.99/slide, no minimum.
Browse All Slides →