Evaluate Services with Detailed Gantt Chart
Product Description
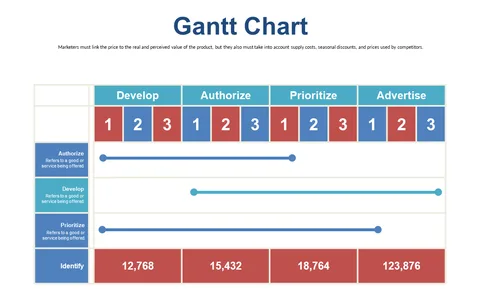
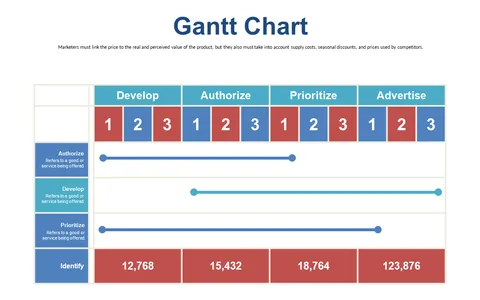
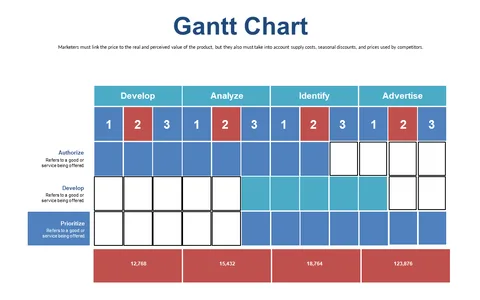
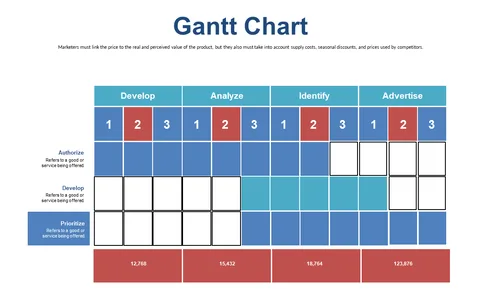
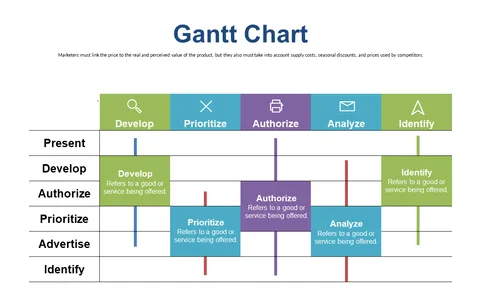
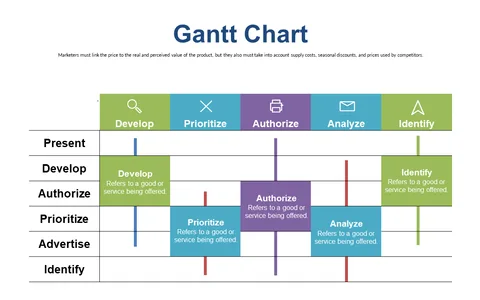
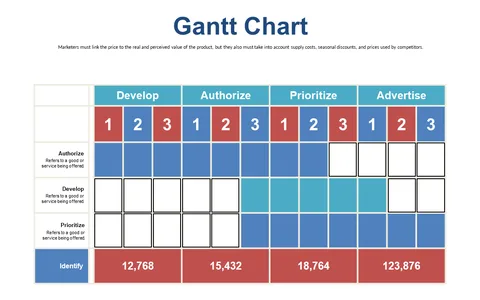
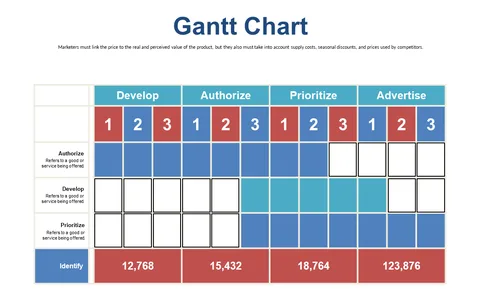
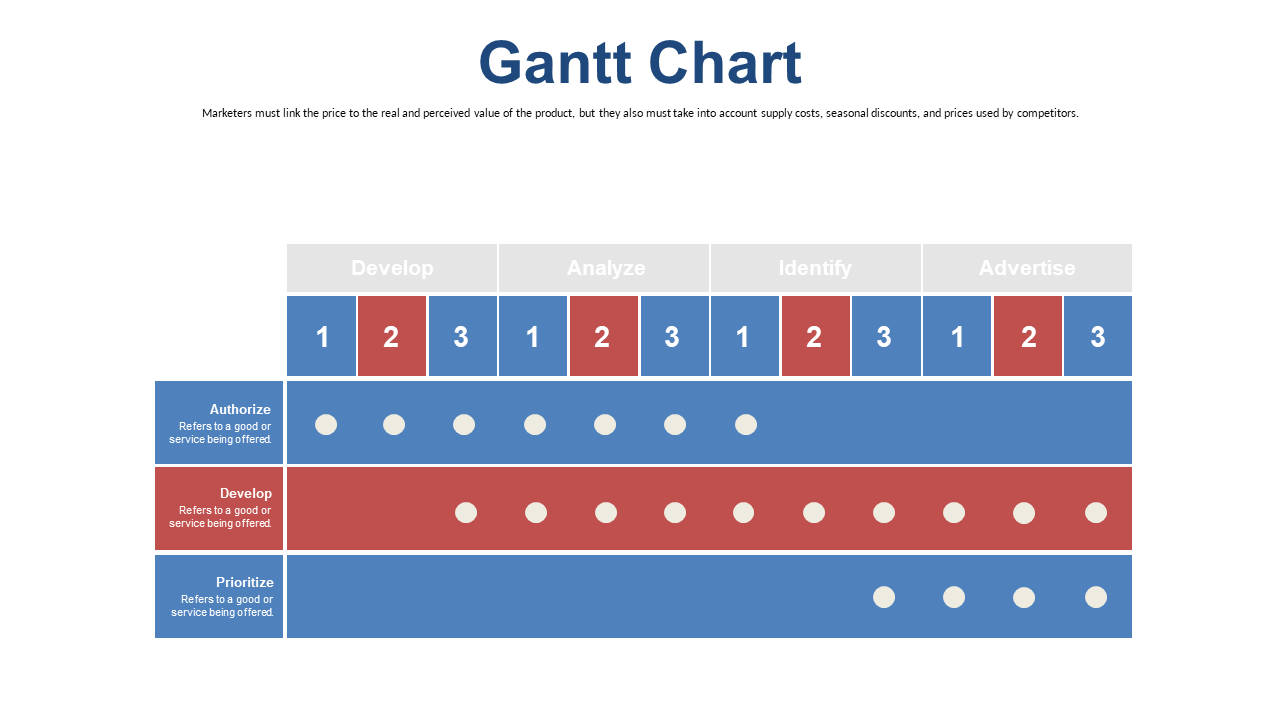
Evaluating services can often lead to confusion, especially when juggling various metrics and timelines. A detailed Gantt Chart helps to illuminate these aspects, giving you a structured view of each service’s performance over time. This clear layout lets you easily assess what’s working and what needs improvement.
This slide is particularly beneficial for service managers, quality control specialists, and operations teams who need to review service performance during evaluations or quarterly reviews. Whether you’re assessing customer support, IT services, or product offerings, this chart simplifies your analysis and presentations.
You can grab this detailed Gantt Chart slide for only $0.99, and it’s ready for instant download. Fully editable in PowerPoint and Google Slides,
you can customize it to fit your evaluation needs without hassle, all within minutes.
$0.99 – Purchase Checkout
Added to cart