Track Service Development with Gantt Chart
Product Description
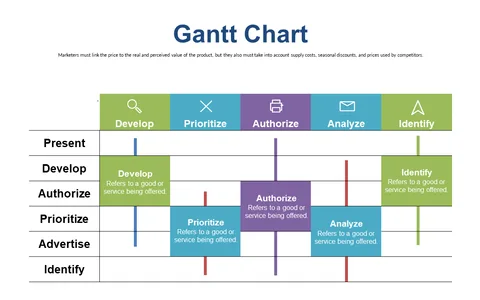
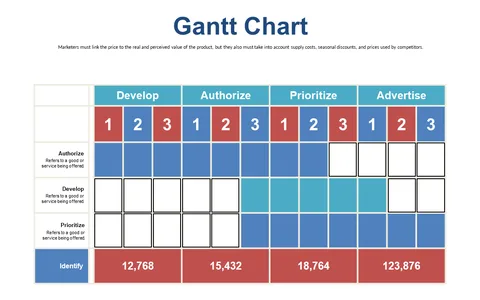
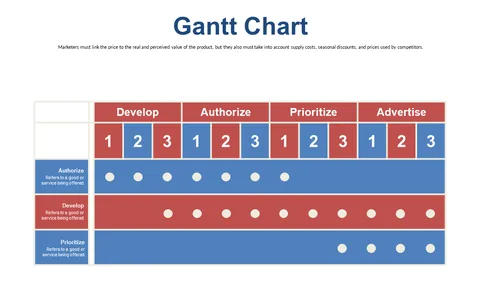
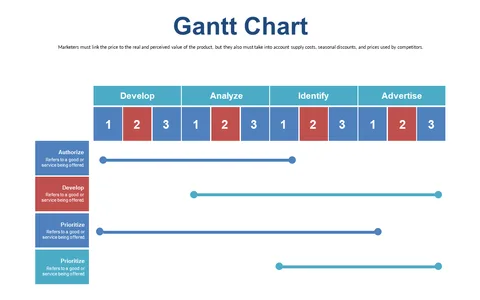
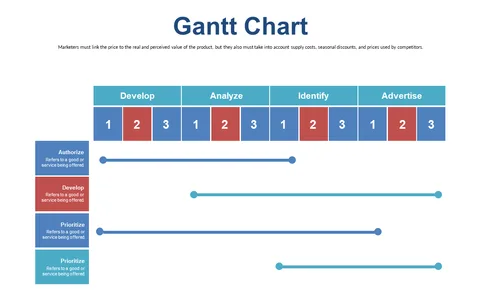
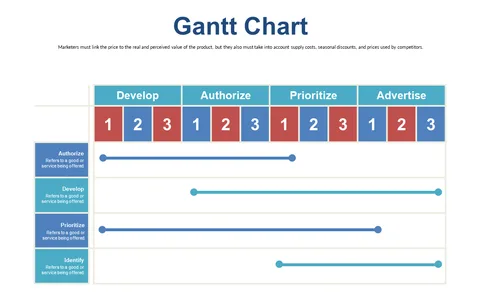
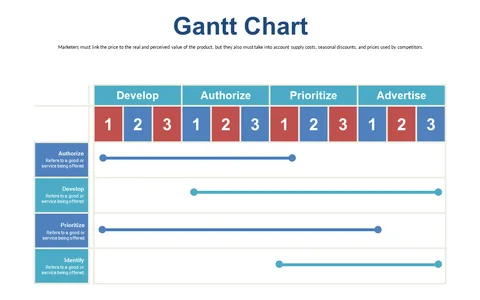
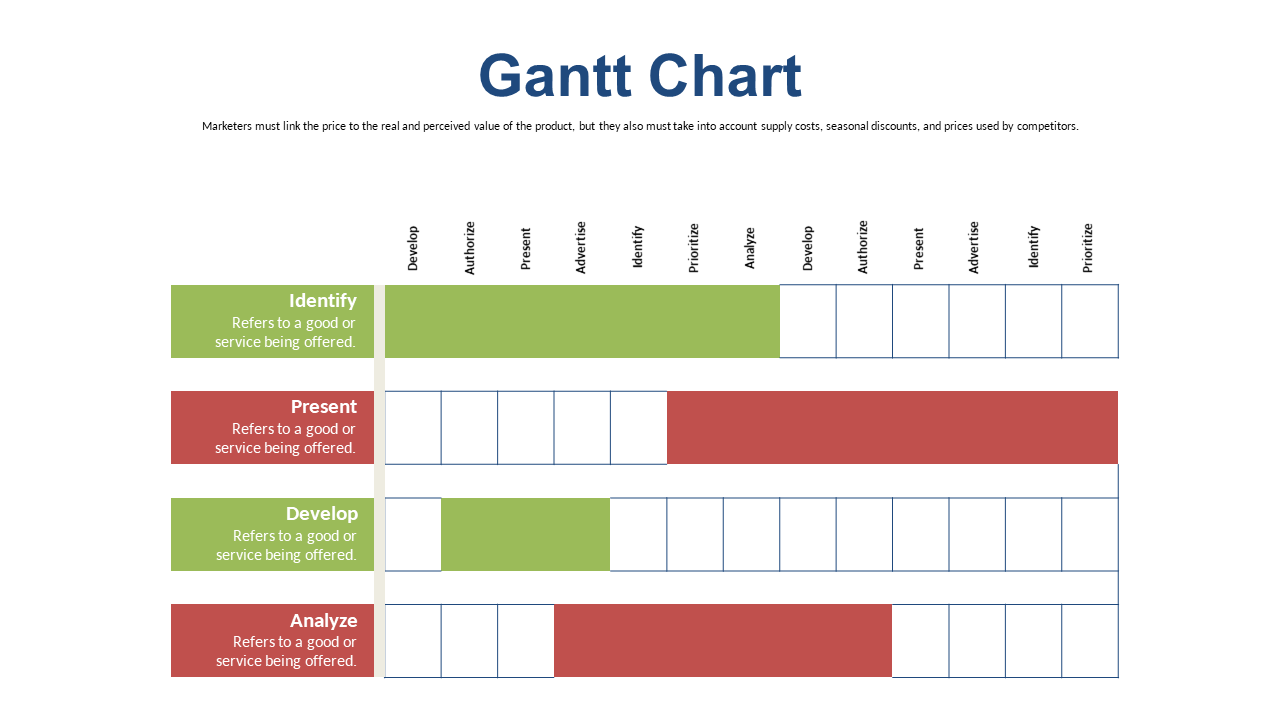
Keeping service development on course can often feel like navigating a complex maze with multiple phases and tight deadlines. This Gantt chart slide provides a visual representation of your project timeline, clearly showing which stages are on track and which require immediate attention. This clarity helps in making informed decisions quickly.
Service managers, product developers, and operations teams will find this slide essential for tracking the various phases of service projects. Whether you’re overseeing software development or managing logistics, this Gantt chart can be a key tool in ensuring your team remains coordinated and focused. Use it in review meetings or as a project planning guide to enhance communication.
You can get this Gantt Chart slide for just $0.99, ready for instant download. It’s fully editable in PowerPoint and Google Slides, so you can easily modify it to suit your unique project needs. Start organizing your service development projects effectively today!
$0.99 – Purchase Checkout
Added to cart