Highlight Customer Journey Stages in Presentations

Product Description
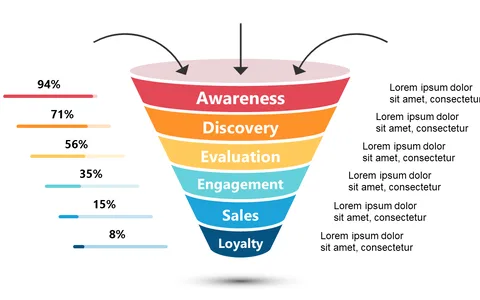
Engaging your audience while explaining the customer journey can feel overwhelming, especially when dealing with complex stages. You need a way to visually break down the journey from awareness to loyalty without losing your listeners in technical jargon.
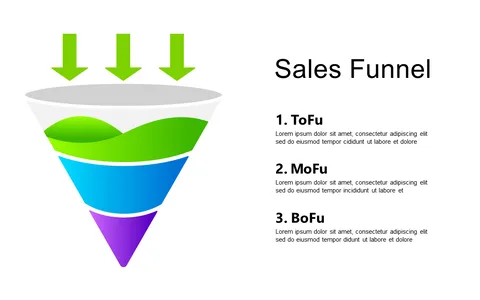
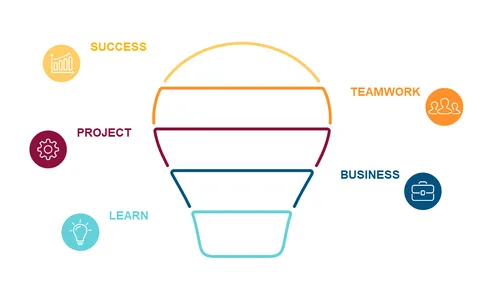
This slide steps in with a clear funnel infographic that simplifies your message. Sales professionals, marketers, and business analysts will find this slide essential during client presentations, strategy sessions, or training workshops. Whether you’re outlining your sales funnel in a quarterly review or explaining customer touchpoints in a marketing meeting, this slide makes your points easier to grasp and remember.
At just $0.99, this slide is an instant download, ready to enhance your presentations in minutes. It’s fully editable in PowerPoint and Google Slides, allowing you to customize it to fit your needs effortlessly.
$0.99 – Purchase Checkout
Added to cart