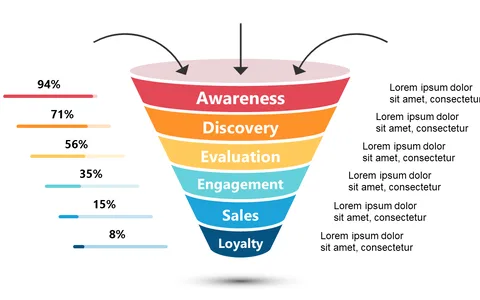
Visualize Customer Engagement with a Funnel Diagram
Product Description
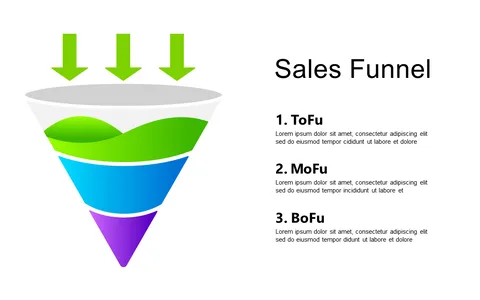
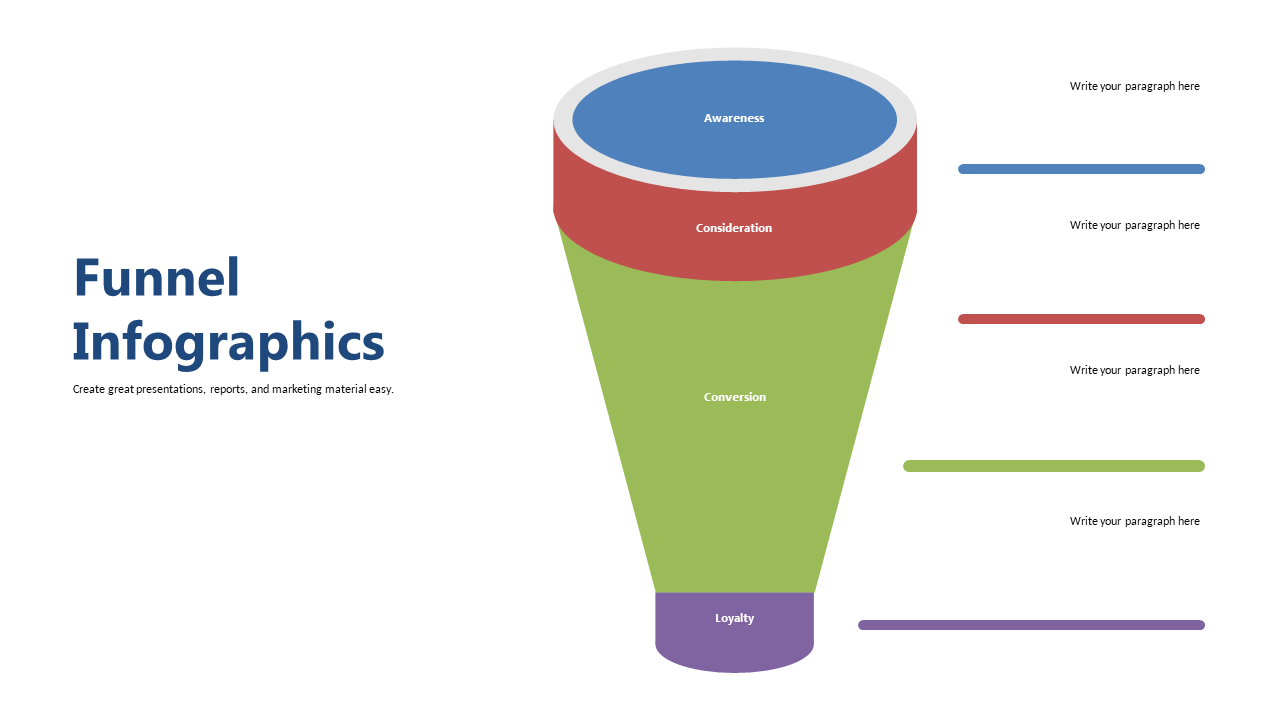
Communicating the stages of customer engagement often leaves audiences puzzled, especially when relying on text-heavy slides. This funnel diagram provides a clear visual representation that simplifies the concept, making your key metrics easy to comprehend.
You’ll find this slide invaluable for sales executives presenting growth strategies, marketing teams analyzing engagement data, or retail managers discussing customer behavior. It’s an excellent addition for anyone needing to articulate performance metrics in a concise and engaging manner.
For only $0.99, you can download this slide instantly and edit it seamlessly in PowerPoint or Google Slides. Get ready to impress your audience with a clear, effective visual in just a matter of minutes.
$0.99 – Purchase Checkout
Added to cart