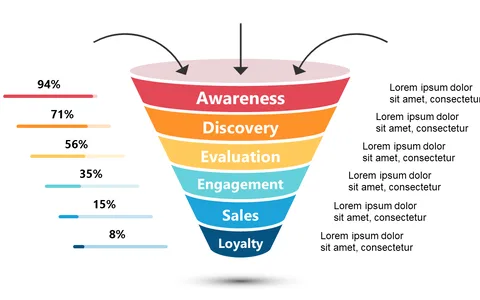
Outline Customer Journey with a Funnel Infographic
Product Description
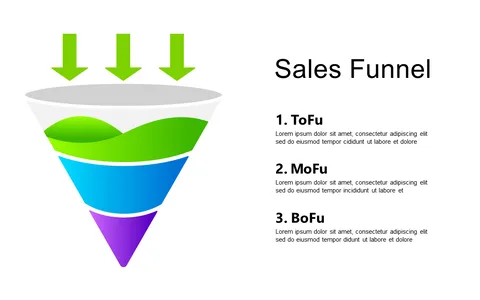
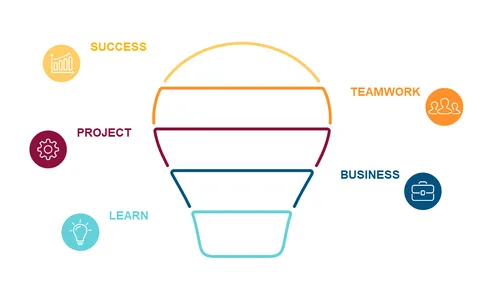
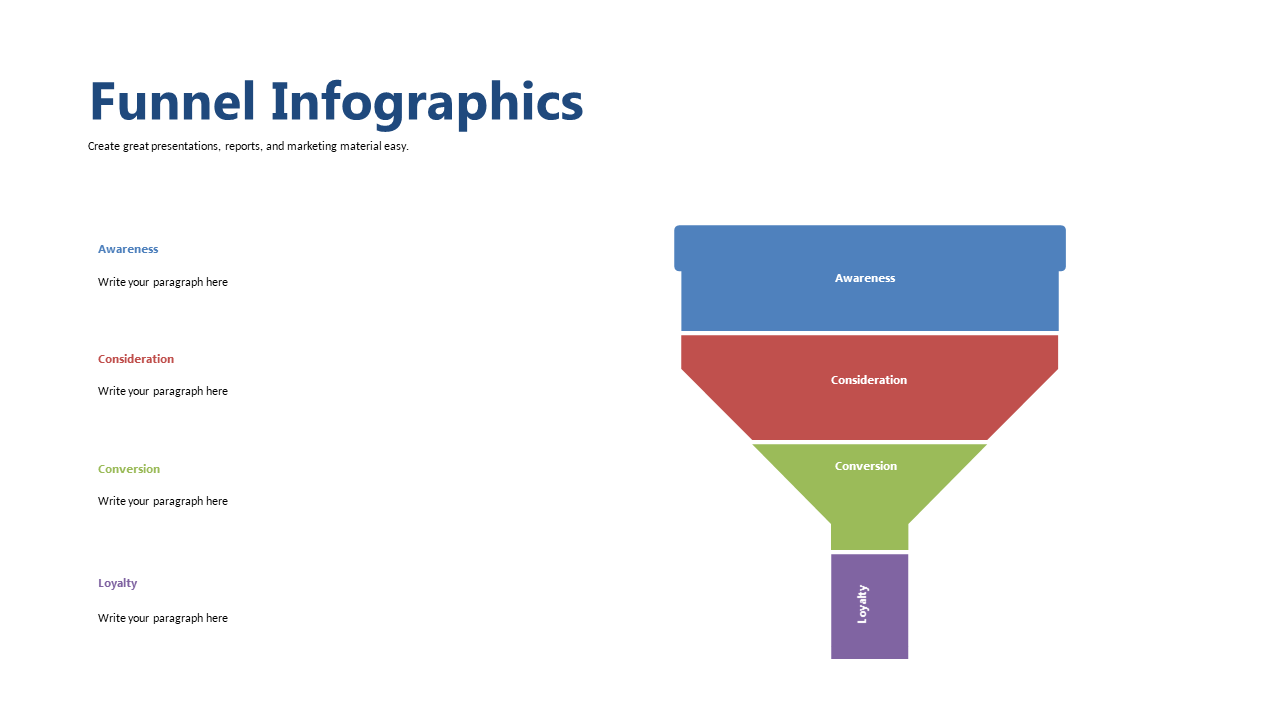
Finding the right way to depict the customer journey can be daunting, especially with so many stages to cover. A funnel infographic simplifies this process by breaking the journey into clear, digestible steps, allowing your audience to grasp complex concepts quickly.
Ideal for sales teams reviewing their approach, marketing analysts sharing insights, or business consultants advising clients, this slide enhances understanding and drives home your points effectively. Whether in a pitch meeting or a training session, it can make all the difference.
At just $0.99, this slide is ready for instant download and can be effortlessly edited in PowerPoint or Google Slides. Have a compelling visual ready in mere minutes to elevate your presentations.
$0.99 – Purchase Checkout
Added to cart