Show Marketing Phases with Engaging Funnel Infographic

Product Description
Understanding the different phases of the customer journey can feel overwhelming, especially when trying to maintain your audience’s interest. A clear and engaging visual can help break down complex information into digestible parts.
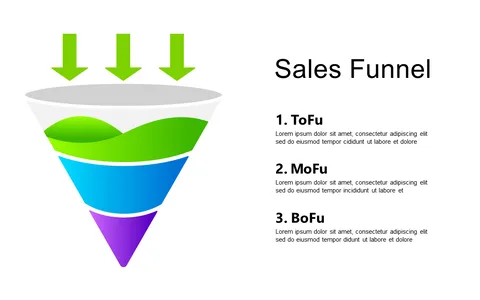
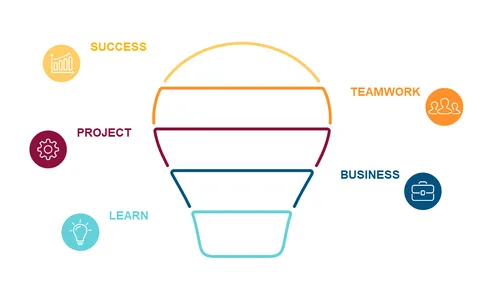
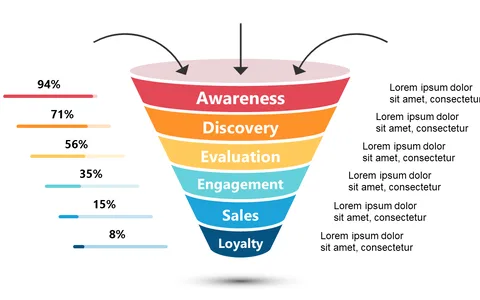
This funnel infographic effectively illustrates the key stages, making it easier to communicate your marketing strategy. This slide is perfect for business analysts, marketing coordinators, and customer experience managers who need to present customer journey insights during strategy meetings or workshops. It helps you clearly convey how potential customers move from awareness to loyalty, which is crucial for aligning team efforts and goals.
For just $0.99, you can download this slide instantly. It’s fully editable in PowerPoint and Google Slides, so you can tailor it to fit your unique needs in just a few minutes, allowing you to impress your audience without the hassle.
$0.99 – Purchase Checkout
Added to cart