Visualize Sales Process with Four-Stage Funnel Infographic

Product Description
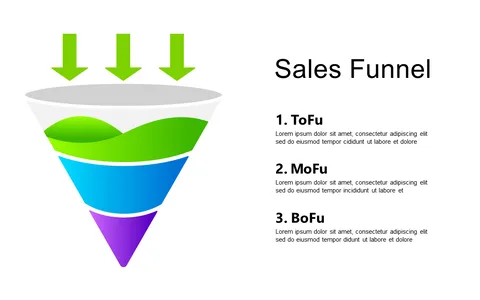
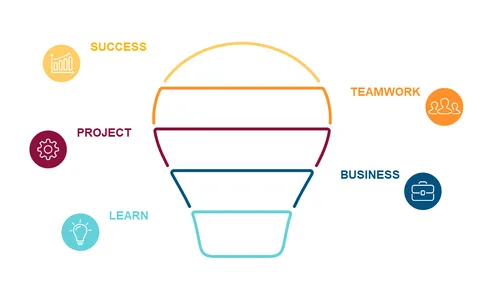
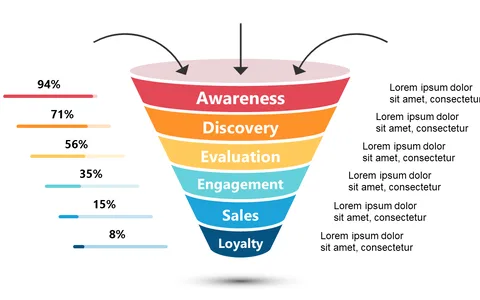
Sales teams often struggle to present their processes clearly, leaving audiences confused about the stages involved in turning prospects into customers. This infographic simplifies the sales journey, enabling you to convey the key steps without getting bogged down in details.
It’s a great fit for sales managers and business development executives who need to clarify their approach during team meetings, client pitches, or training sessions. Using this visual support can enhance your presentations, making the sales process relatable and understandable for everyone involved.
Available for just $0.99, this slide can be instantly downloaded and is easily customized in PowerPoint and Google Slides. You’ll be able to prepare it for your next meeting in no time.
$0.99 – Purchase Checkout
Added to cart