Illustrate Progression from Idea to Result
Product Description
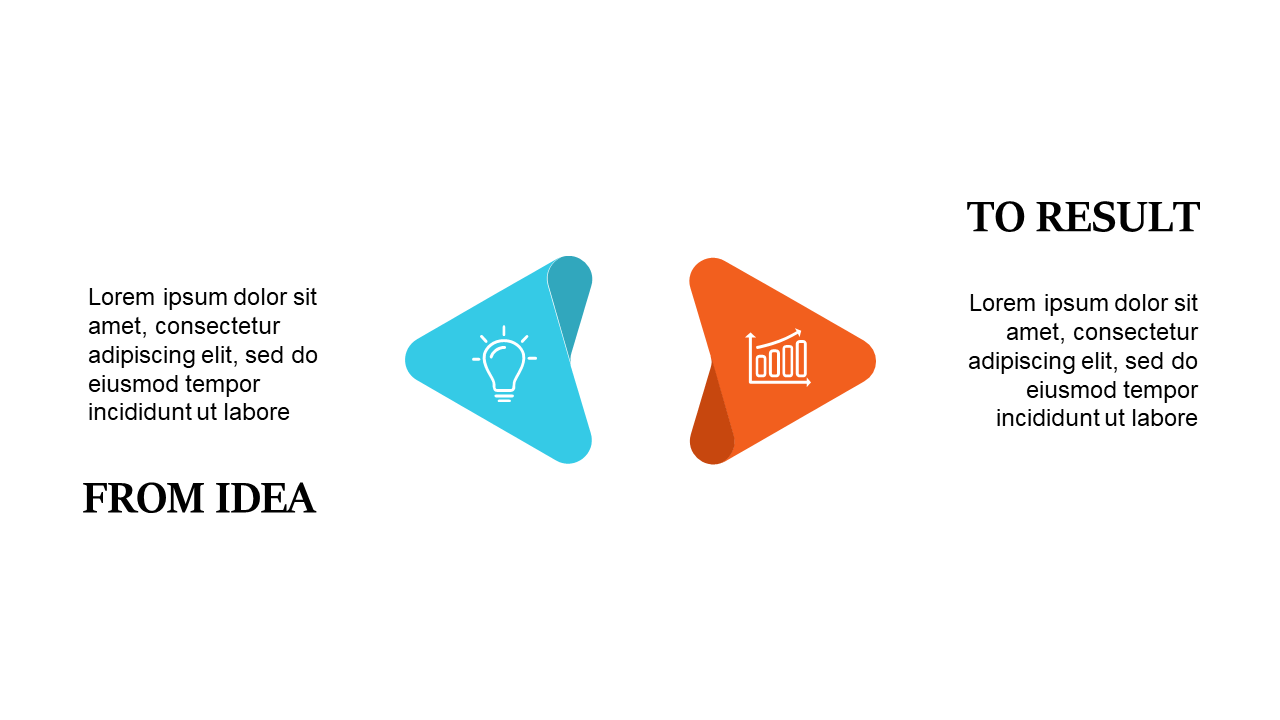
Communicating the journey from an initial idea to a tangible result can be challenging, especially when clarity is vital. This slide visually represents that progression through two triangular shapes, making your message straightforward and impactful. It’s designed to help your audience understand the flow of thought to execution with ease.
This slide is great for creative directors pitching project concepts, team leads discussing project milestones, or product owners illustrating the development process. It fits perfectly into project briefings, strategy sessions, or any situation where demonstrating progress and outcomes is key.
This visual guide ensures everyone is on the same page. For only $0.99, you can download this slide and start editing it to fit your vision. It’s easy to customize in PowerPoint and Google Slides, allowing you to tailor it to your specific project in just a few minutes.
$0.99 – Purchase Checkout
Added to cart