Compare Concepts with Circular Venn Diagram
Product Description
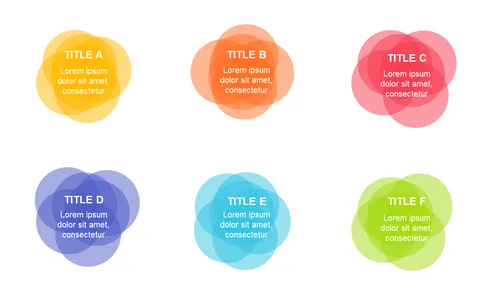
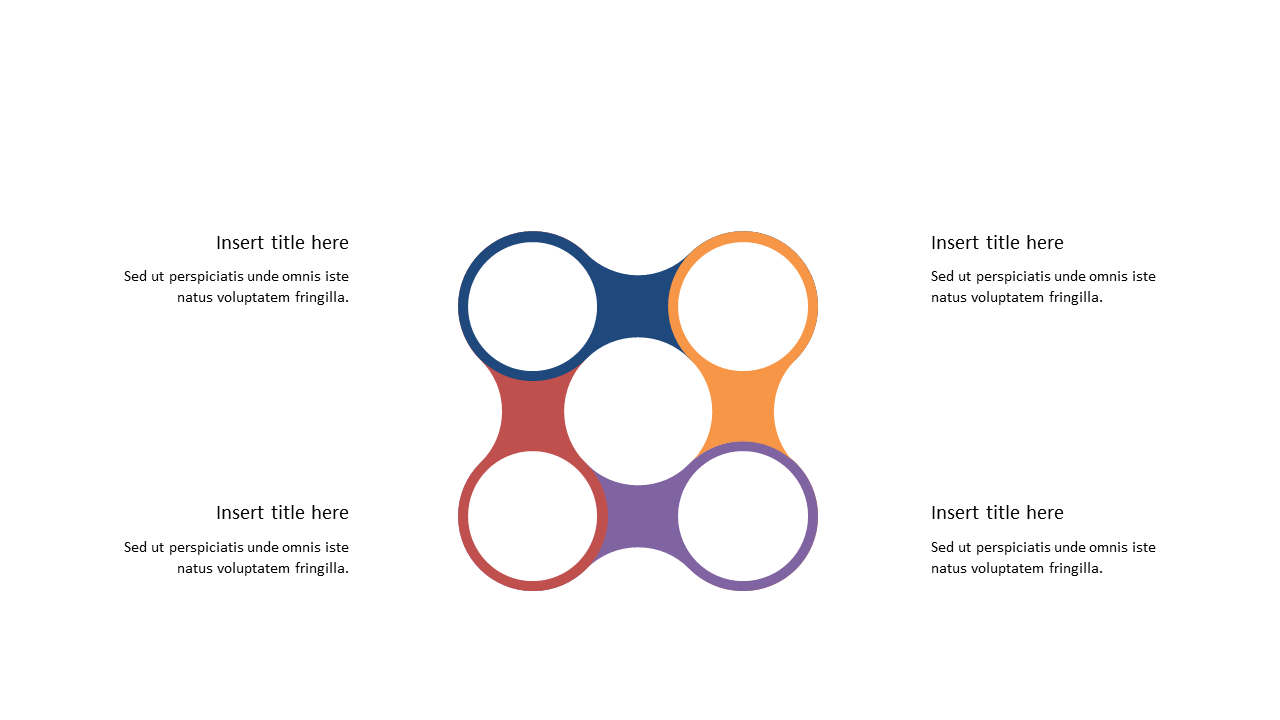
Conveying complex ideas can often leave your audience confused, struggling to see how different concepts relate to one another. A Circular Venn Diagram simplifies this challenge by providing a clear visual that highlights overlaps and distinctions among multiple ideas, making your message more digestible and engaging.
This slide is a perfect fit for educators explaining course intersections, project managers comparing different methodologies, or marketers showcasing overlapping target audiences in their campaigns. It’s a versatile tool for anyone who needs to clarify relationships between concepts in a variety of settings, from team meetings to client presentations.
For just $0.99, this slide is ready for instant download and can be easily edited in both PowerPoint and Google Slides. You’ll have a professional-quality visual in minutes that enhances your presentations without the hassle.
$0.99 – Purchase Checkout
Added to cart