Present Key Options with Circular Infographics
Product Description
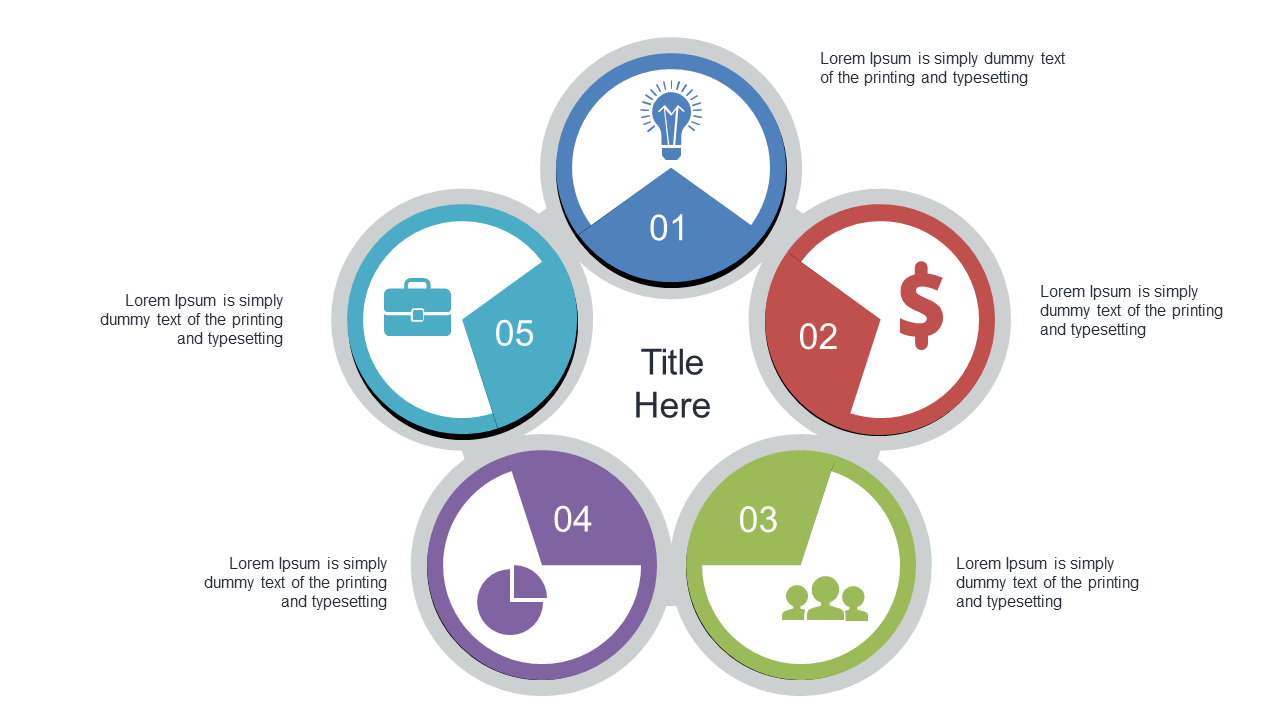
In a world where communication can easily become complex and convoluted, presenting key options clearly is essential. This circular infographic slide simplifies the decision-making process by offering a visually engaging format to display multiple choices.
It makes it easier for your audience to grasp the options available without feeling overwhelmed. This slide is an excellent fit for business analysts sharing data-driven recommendations, finance professionals outlining investment choices, or any leader discussing strategic directions with their team. Use it during strategic planning sessions, pitch meetings, or workshops where clarity is critical to informed decision-making.
Available for only $0.99, this slide can be downloaded immediately and customized in PowerPoint or Google Slides. Editing is straightforward, letting you adapt it to your specific presentation needs in just a few minutes.
$0.99 – Purchase Checkout
Added to cart







