Categorize Causes with Fishbone Diagram Template
Product Description
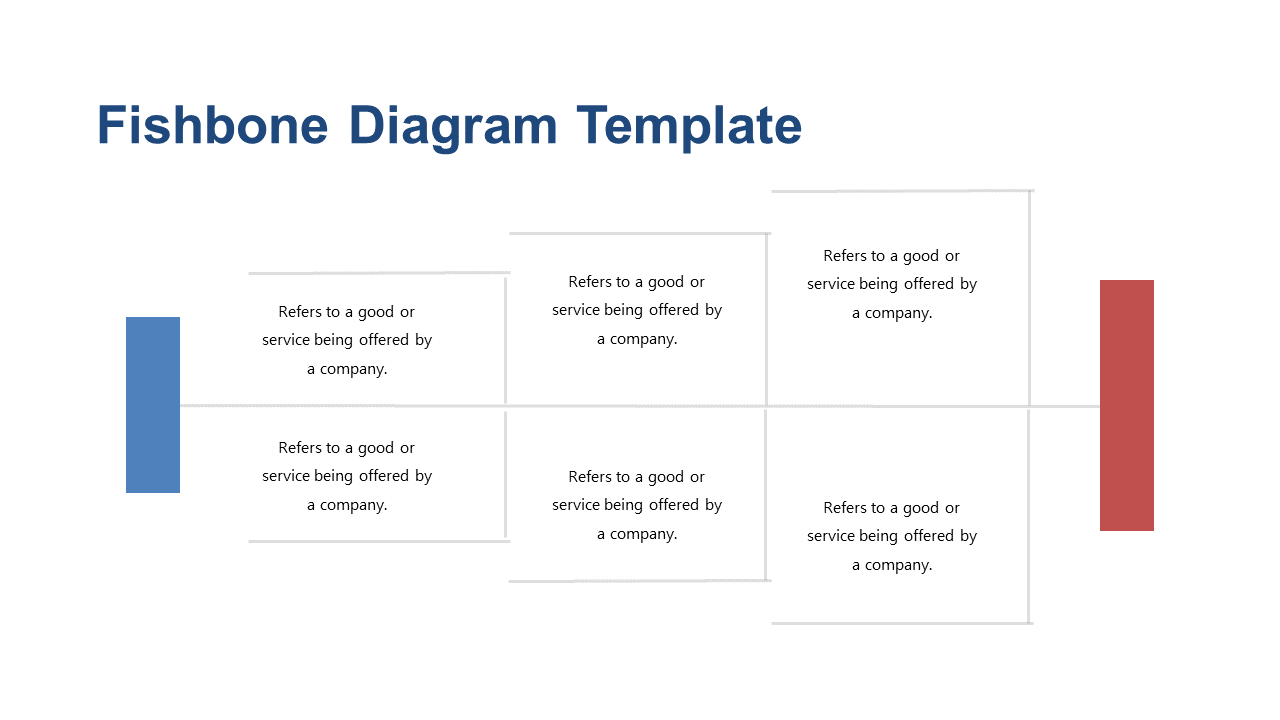
Tackling complex issues often involves visualizing potential causes to understand the bigger picture. This Fishbone Diagram slide provides a structured layout that helps you categorize and break down problems systematically.
It’s an effective tool for making sense of challenging situations and facilitating discussions around solutions. Quality managers and process improvement specialists can benefit from using this template in workshops or team meetings focused on identifying root causes. Whether you’re an operations manager assessing process breakdowns or an HR professional dealing with employee feedback, this slide will help clarify the path to resolution.
For just $0.99, this slide is ready for immediate download and can be easily customized in PowerPoint or Google Slides. Get your insights organized in minutes and elevate your problem-solving discussions effortlessly.
$0.99 – Purchase Checkout
Added to cart







