Facilitate Quality Management with Fishbone Diagram V2
Product Description
Root cause analysis can be daunting, particularly when it comes to determining the specific factors affecting quality. You need a clear way to visualize potential causes so you can address them effectively.
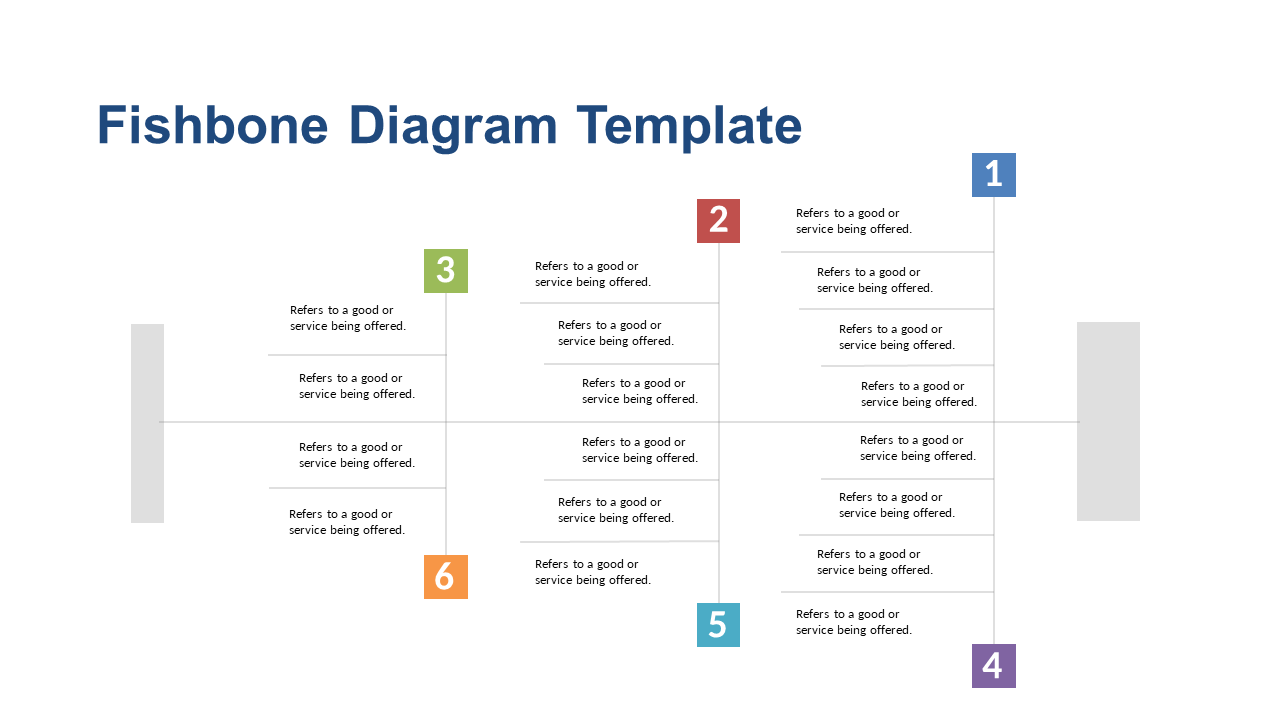
This fishbone diagram slide streamlines that process with a straightforward layout that highlights various categories of influencing factors. Quality control managers and process improvement specialists will find this diagram helpful in team meetings or training sessions. If you’re conducting a workshop to identify areas for quality improvement, this tool provides a visual method for discussing and dissecting issues that hinder performance.
For just $0.99, you can download this slide immediately and modify it to fit your needs in PowerPoint or Google Slides. It’s ready to go in a matter of minutes, allowing you to focus on improving quality without the hassle.
$0.99 – Purchase Checkout
Added to cart







