SlideSwift
By Category
💼Business 📊Infographics □Minimal 🕐Timelines ✨Neumorphic 🗑Diagrams 🔄Flow Charts ✨Glassmorphism 🎨Creative 🌍Abstract 🔄Cycle Diagrams 💎Isometric 🖼Illustrations 📱Social Media 🗺MapsBy Slide Type
🚀Pitch Deck 📌Roadmap 🔍SWOT Analysis 📅Timeline 📈Gantt Chart 🏢Org Chart 📋Funnel ⚖Comparison 📄Case Study 📋Agenda ⭐Icons & Lists 👏Thank You
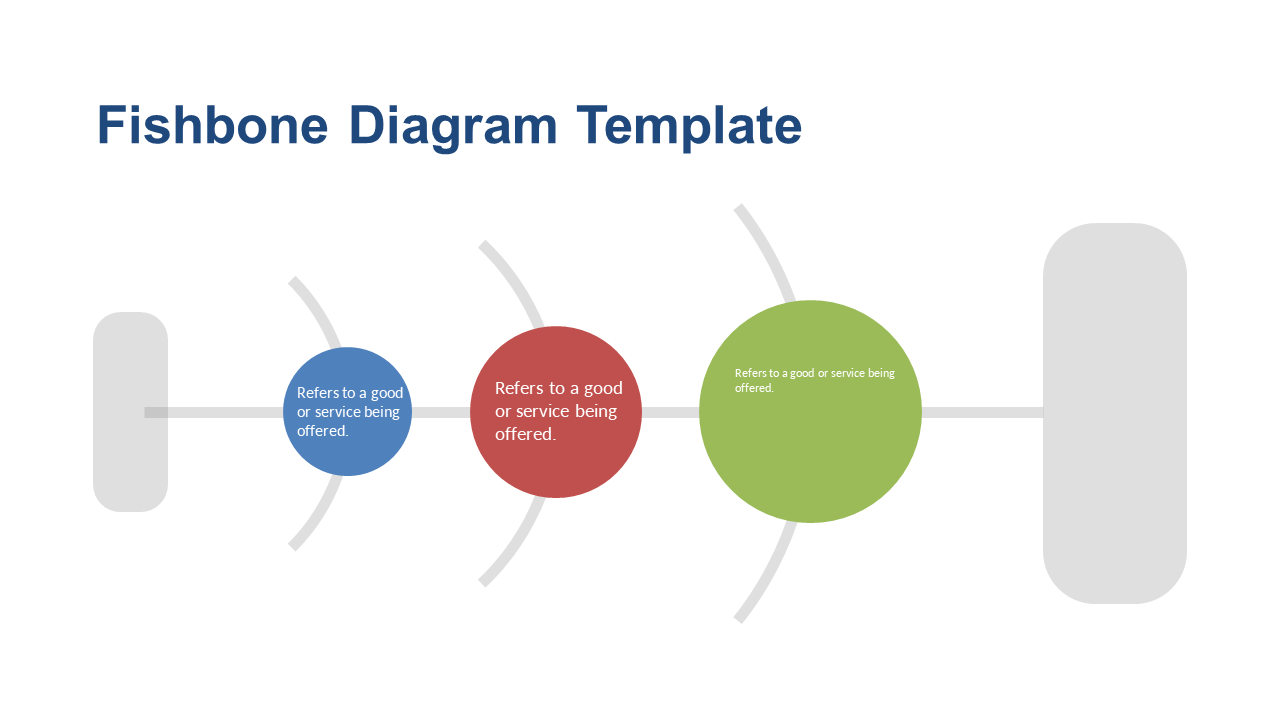
Identifying the root cause of a problem can often feel like searching for a needle in a haystack. Without the right tools, discussions can become unproductive, leaving teams frustrated. This Fishbone Diagram slide simplifies the process by visually mapping out the various factors contributing to an issue. You’ll see clear sections for causes arranged in a way that promotes understanding and collaboration among team members. As a consultant, you can easily use this diagram to present findings during client meetings, helping stakeholders grasp complex issues at a glance. An operations manager might integrate this slide into a performance review meeting to analyze inefficiencies in a process, making it easier to pinpoint areas for improvement. Meanwhile, a business analyst can utilize this diagram to facilitate brainstorming sessions, encouraging team members to contribute thoughts on potential causes. Customize the sections to suit your specific needs and ensure everyone is on the same page. $0.99 — add this single slide to any deck from the SlideSwift Slide Library. No subscription needed. Mix slides from any category to build your perfect deck.
Add more from this category to your custom deck