Visualize Causes with Fishbone Diagram Template
Product Description
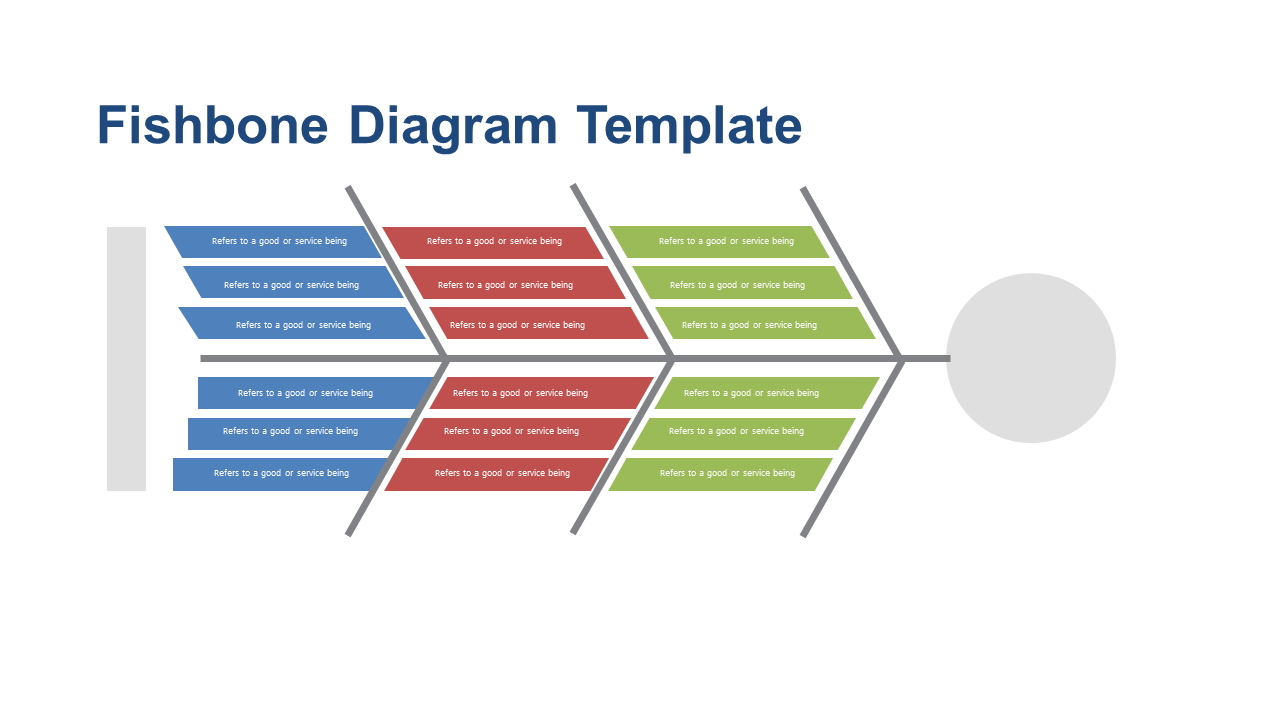
When trying to address complex project issues, it can be challenging to identify and communicate the root causes lurking underneath. A visual tool like the Fishbone Diagram makes it easier to map out the factors contributing to a problem, ensuring everyone is on the same page and facilitating a collaborative approach to problem-solving.
Project managers, quality assurance specialists, and team leaders can rely on this slide during project retrospectives or troubleshooting sessions, where understanding the underlying causes is crucial to avoiding future pitfalls. It’s designed to foster discussion and clarity, making it a great addition to any meeting focused on continuous improvement.
Download this slide for only $0.99, and you’ll be able to edit it easily in both PowerPoint and Google Slides. Get started right away with this visual tool that can simplify your discussions and analysis in just a few clicks.
$0.99 – Purchase Checkout
Added to cart