SlideSwift
By Category
💼Business 📊Infographics □Minimal 🕐Timelines ✨Neumorphic 🗑Diagrams 🔄Flow Charts ✨Glassmorphism 🎨Creative 🌍Abstract 🔄Cycle Diagrams 💎Isometric 🖼Illustrations 📱Social Media 🗺MapsBy Slide Type
🚀Pitch Deck 📌Roadmap 🔍SWOT Analysis 📅Timeline 📈Gantt Chart 🏢Org Chart 📋Funnel ⚖Comparison 📄Case Study 📋Agenda ⭐Icons & Lists 👏Thank You
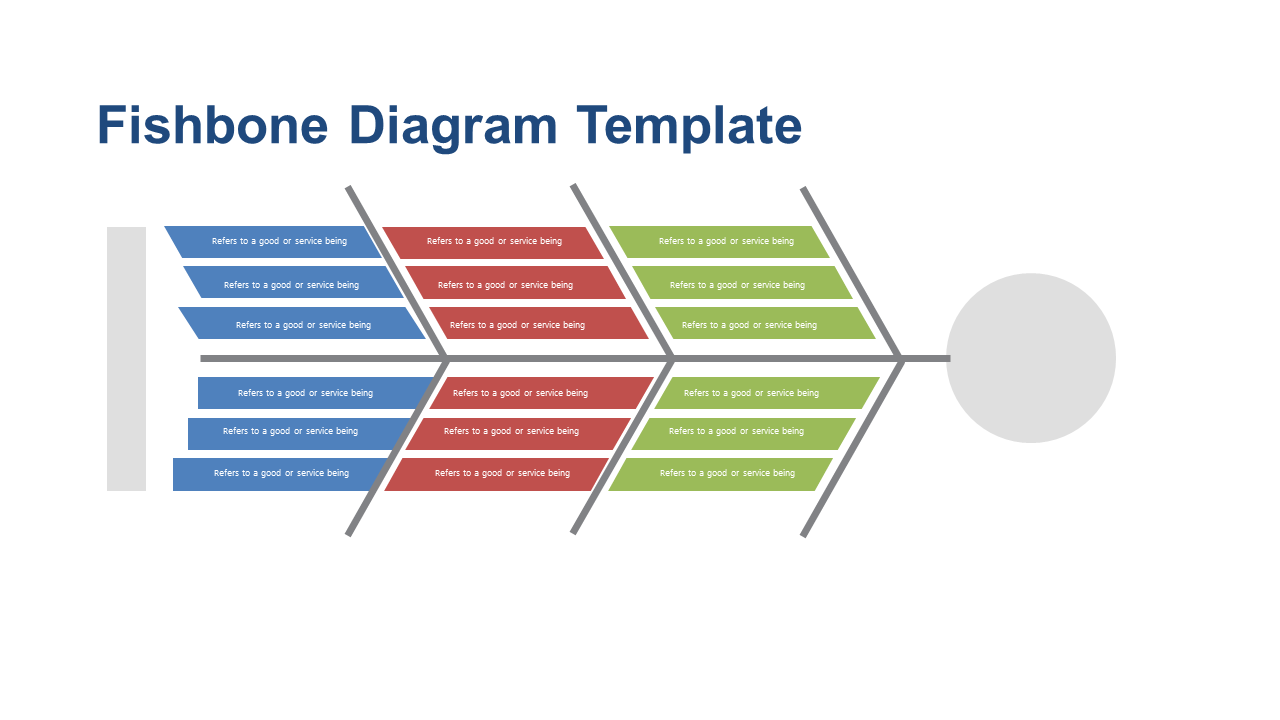
Operations managers often need to pinpoint the root causes of issues impacting their workflow. The Fishbone Diagram slide is an intuitive visual tool that lays out the various causes affecting a particular problem, making it easier to analyze and address. With clear sections categorized by potential factors, this slide helps to simplify complex discussions and drives focus during problem-solving sessions. As an operations manager, you can use this slide to lead a meeting focused on quality control, identifying bottlenecks, or improving processes within your team. A business analyst can leverage this visual to present findings related to data trends and their possible causes, fostering collaborative insights with stakeholders. Meanwhile, an architect can apply this diagram to disclose potential design flaws or challenges during project planning discussions. The editable fields allow for easy customization to fit your specific needs or context. $0.99 — add this single slide to any deck from the SlideSwift Slide Library. No subscription needed. Mix slides from any category to build your perfect deck.
Add more from this category to your custom deck