Explore Cause and Effect with Fishbone Diagram
Product Description
You often find yourself stuck in a maze of complex problems, trying to uncover the root cause but only spiraling deeper into confusion. It can be a daunting task to visualize how different factors contribute to an issue, making it challenging to communicate your findings.
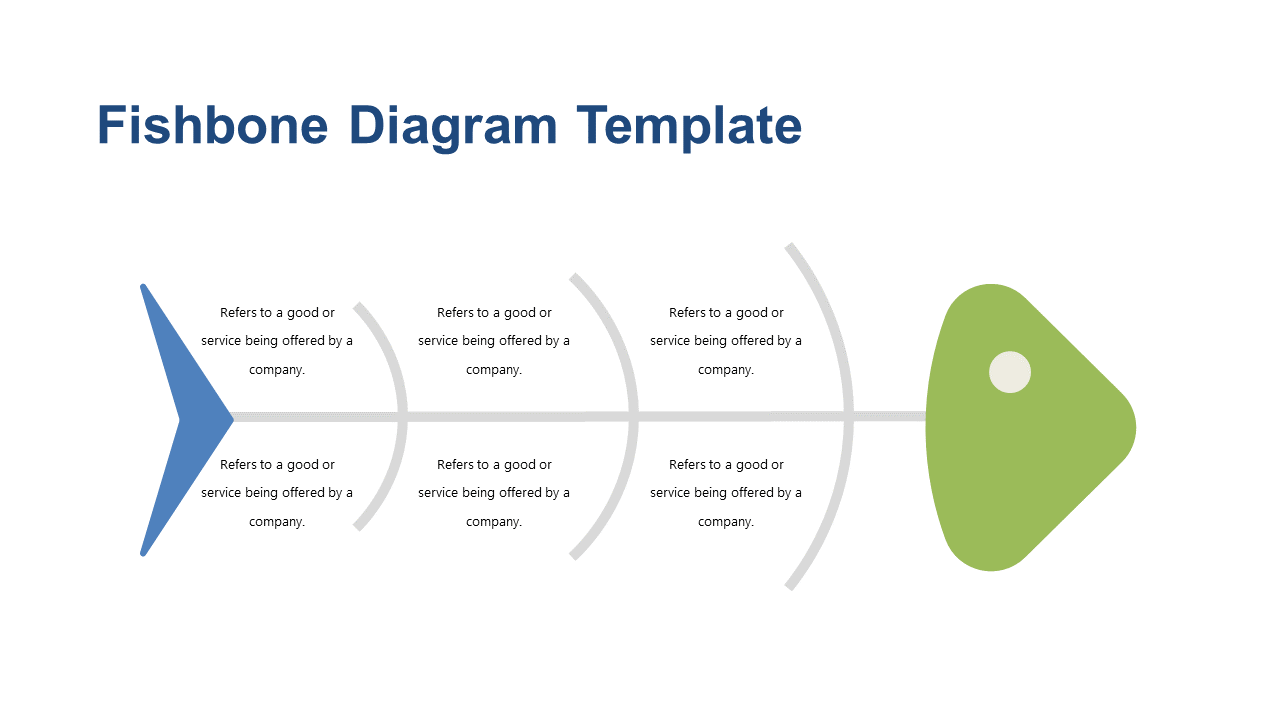
The Fishbone Diagram offers a clean and structured way to outline cause and effect relationships, turning chaos into clarity. This slide is perfect for project managers navigating team challenges, quality assurance professionals identifying defects, or healthcare workers exploring patient care issues. Whether you’re presenting in a team meeting to address project setbacks or leading a brainstorming session to improve processes, this visual tool will help you and your audience grasp the intricate web of issues at play.
For just $0.99, you can download this slide instantly and edit it easily in PowerPoint or Google Slides. You’ll have a professional-looking diagram ready to go in minutes, making it simple to shed light on those tricky problems.
$0.99 – Purchase Checkout
Added to cart