Analyze Causes with Fishbone Diagram Template
Product Description
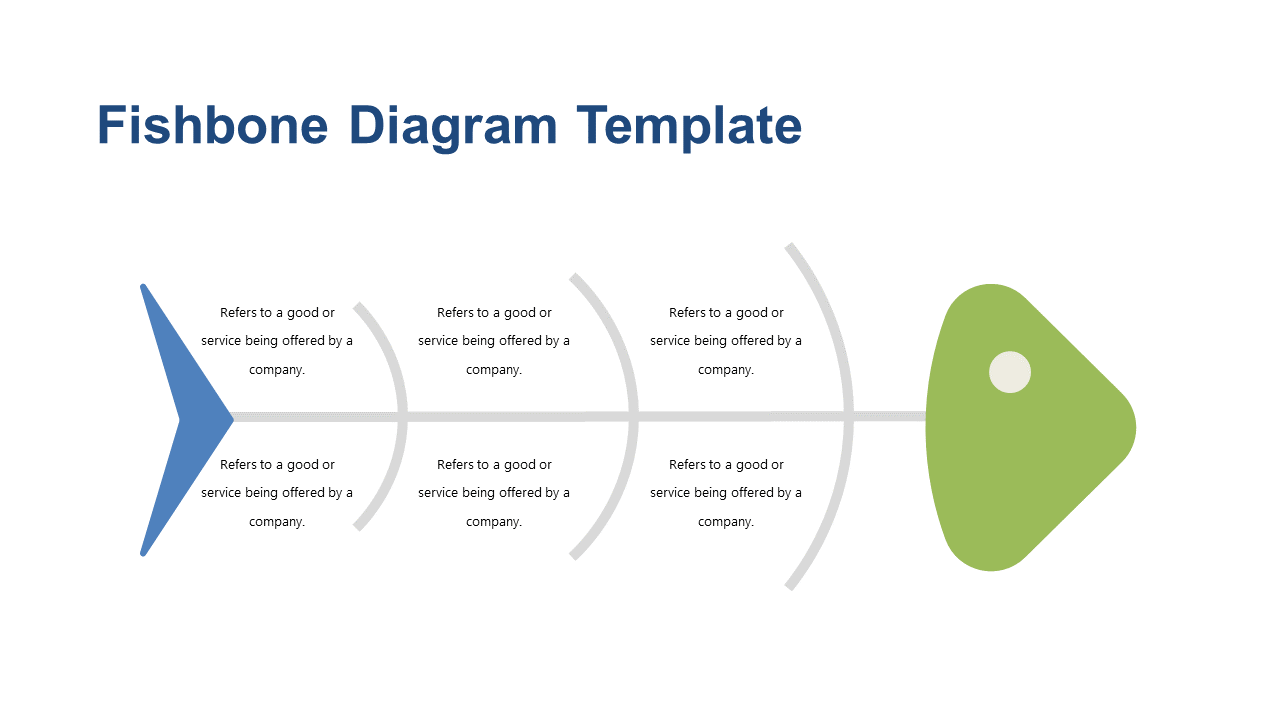
When projects hit a snag, figuring out the root cause can feel like searching for a needle in a haystack. Without a clear approach to analyzing the various factors at play, you risk misdiagnosing issues and wasting time. This Fishbone Diagram Slide effectively organizes and visualizes potential causes, helping you pinpoint what truly needs attention.
It’s an ideal tool for team leaders, business analysts, and consultants who need to dissect project challenges in meetings or workshops. Imagine using this slide during a project retrospective to demonstrate how various elements contributed to the outcome, or in a strategy session to help your team focus on the most impactful areas for improvement.
At just $0.99, this slide is available for instant download and is fully editable in both PowerPoint and Google Slides.
You can customize it to fit your specific needs in no time, making it a breeze to share your insights with the team.
$0.99 – Purchase Checkout
Added to cart







