SlideSwift
By Category
💼Business 📊Infographics □Minimal 🕐Timelines ✨Neumorphic 🗑Diagrams 🔄Flow Charts ✨Glassmorphism 🎨Creative 🌍Abstract 🔄Cycle Diagrams 💎Isometric 🖼Illustrations 📱Social Media 🗺MapsBy Slide Type
🚀Pitch Deck 📌Roadmap 🔍SWOT Analysis 📅Timeline 📈Gantt Chart 🏢Org Chart 📋Funnel ⚖Comparison 📄Case Study 📋Agenda ⭐Icons & Lists 👏Thank You
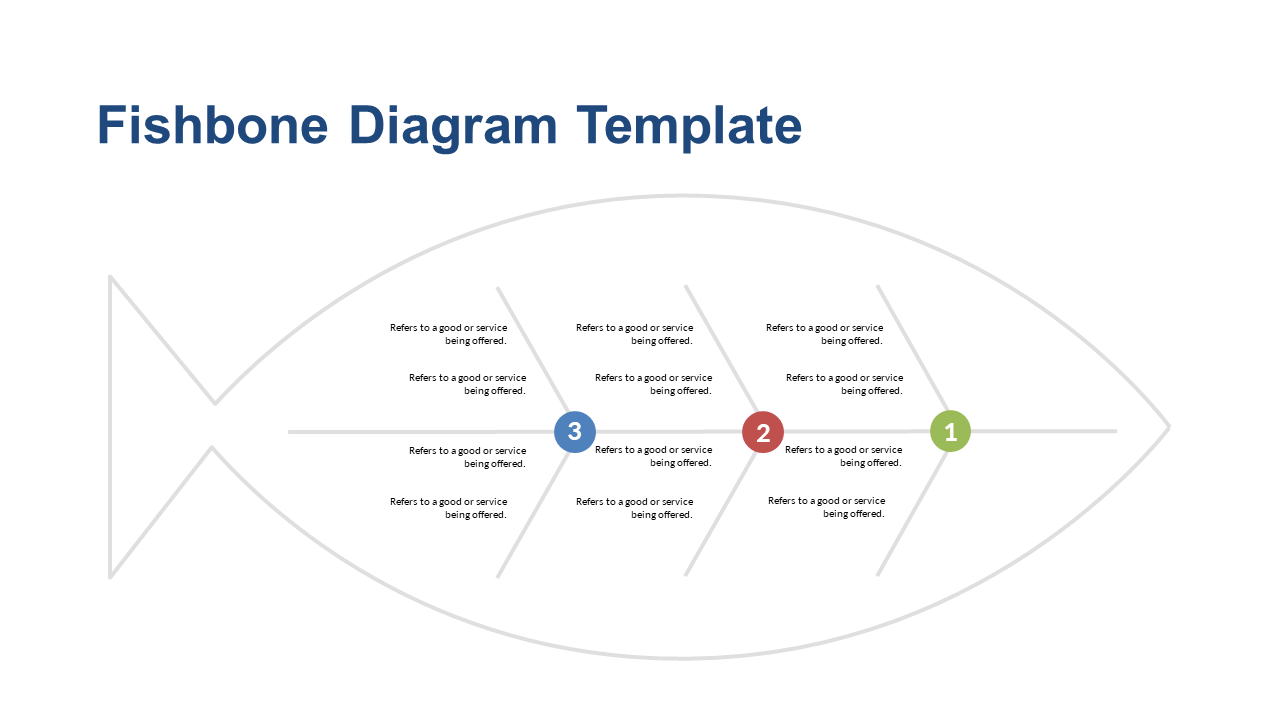
When faced with complex problems, having a clear visual tool can make all the difference. This customizable fishbone diagram is designed for precise cause analysis, allowing you to identify and categorize potential issues at a glance. The layout is clean and straightforward, featuring distinct sections for various causes and sub-causes, making it easy to fill in your team’s insights. As a business analyst, you can use this slide during meetings to facilitate discussions on root causes and solutions, streamlining your analysis process. Architects can leverage this diagram to assess design flaws and operational inefficiencies, ensuring that all aspects are considered. Meanwhile, consultants can present this slide to clients, guiding them through a structured problem-solving approach that enhances clarity and engagement. Don’t forget, this slide is customizable; you can easily modify colors and labels to fit your brand. $0.99 — add this single slide to any deck from the SlideSwift Slide Library. No subscription needed. Mix slides from any category to build your perfect deck.
Add more from this category to your custom deck