Categorize Services with a Fishbone Diagram Template
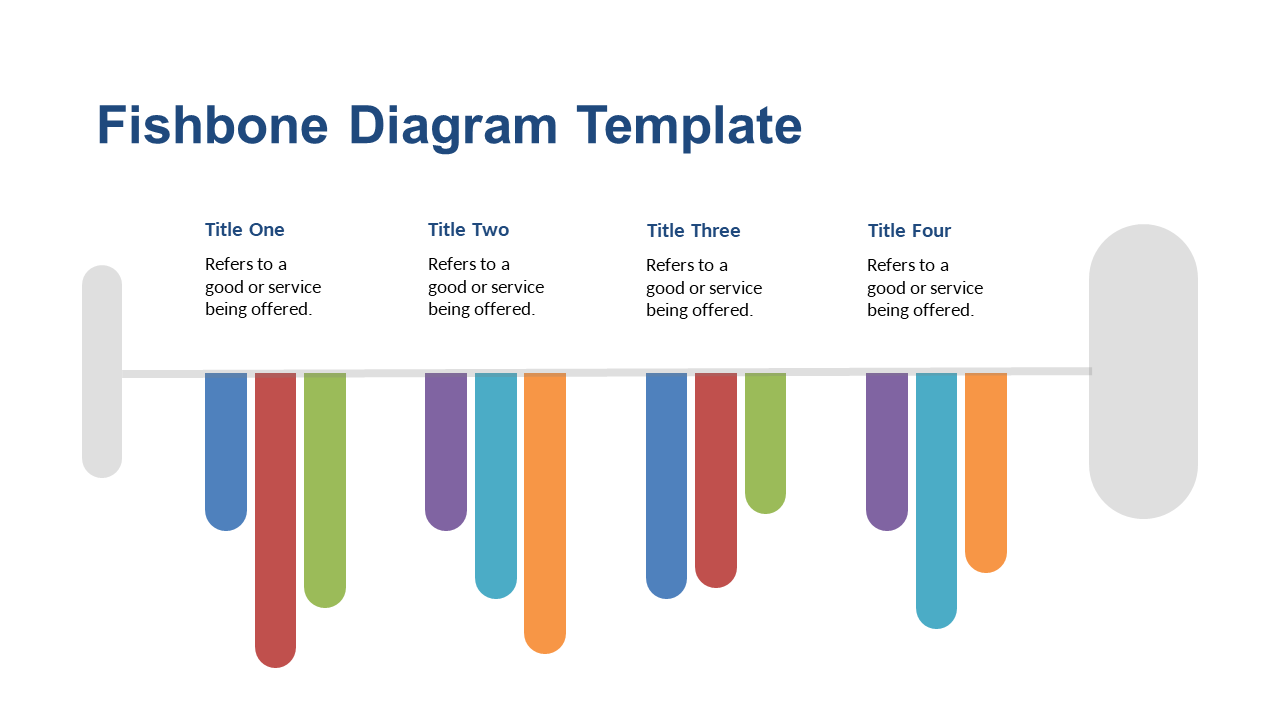
Product Description
Presenting service offerings can be overwhelming, especially when trying to convey relationships and complexities in a clear manner. The Fishbone Diagram helps you organize various services, making it easier to identify potential issues and areas for improvement.
This visual clarity can be a game-changer when conveying your message to stakeholders. Business analysts, project managers, and team leads in sectors like IT, healthcare, or consulting can benefit from this slide during strategy meetings or service reviews. Use it to illustrate how different factors may impact service delivery or to conduct root cause analysis during problem-solving sessions.
For just $0.99, you can download this editable Fishbone Diagram slide, which is ready for use in PowerPoint or Google Slides. It’s quick to modify and customize, ensuring you can focus on your insights without wasting time on formatting.
$0.99 – Purchase Checkout
Added to cart







