Identify Root Causes with Fishbone Diagram
Product Description
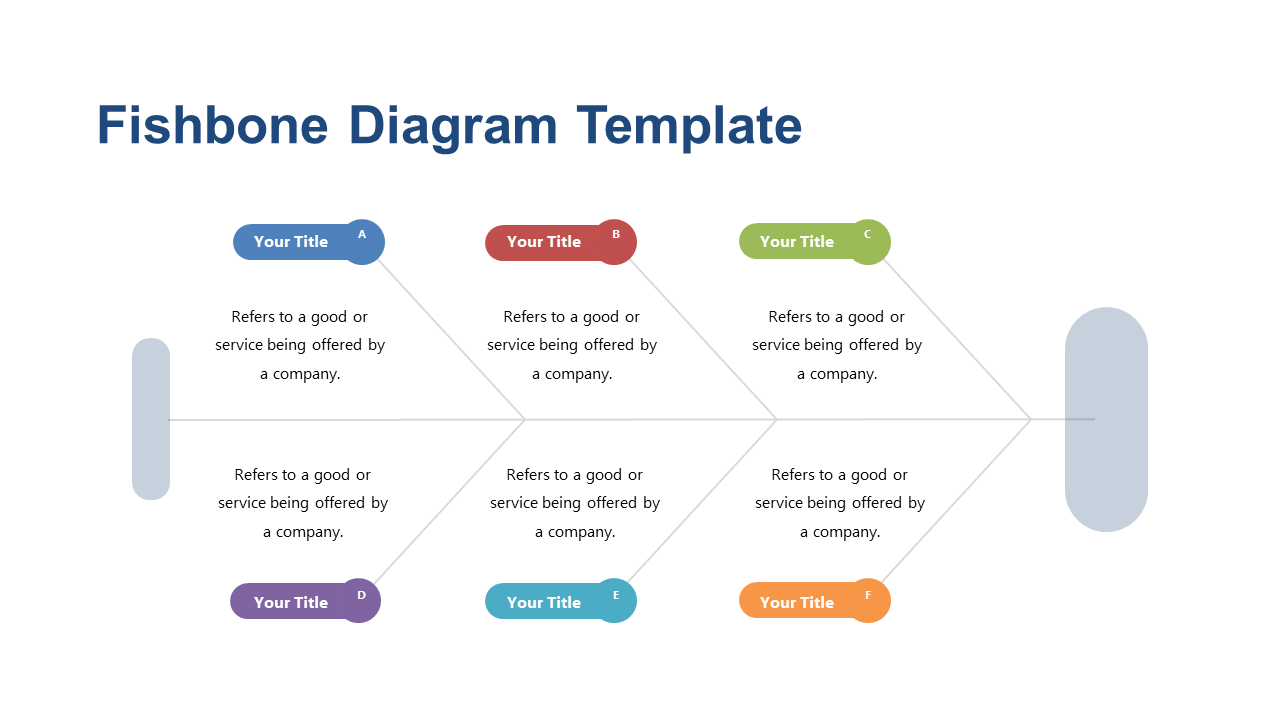
Tackling complex problems often involves sifting through layers of potential causes, which can lead to confusion and frustration. This fishbone diagram slide presents a structured approach to identifying root causes, allowing you to visually categorize issues and enhance problem-solving efficiency for your team.
Professionals in quality assurance, operations management, or project management will find this slide useful during team brainstorming sessions, root cause analysis meetings, or even in reports. By breaking down complex issues into manageable segments, you can foster productive discussions and drive solutions more effectively.
At just $0.99, this slide is ready for immediate download and easy to customize. You can edit it in both PowerPoint and Google Slides, letting you adapt it quickly to suit your specific challenges.
$0.99 – Purchase Checkout
Added to cart







