Analyze Issues with Fishbone Diagram Layout
Product Description
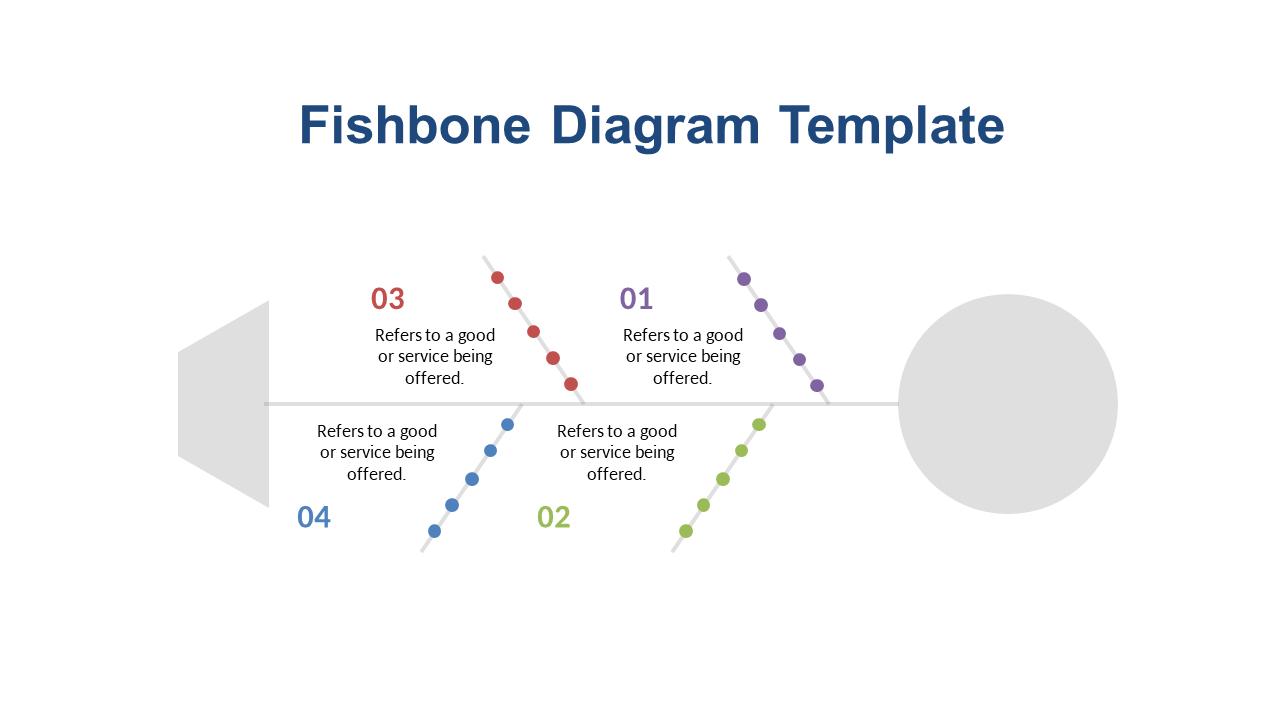
Identifying the root causes of complex issues can often feel like searching for a needle in a haystack, especially for operations managers. Without a clear visual aid, it’s easy to become overwhelmed by the myriad factors at play. This Fishbone Diagram layout breaks down the problem visually, making it simpler to analyze and address the underlying causes.
You’ll find this slide particularly useful in settings like manufacturing meetings, quality control reviews, or even team brainstorming sessions focused on process improvements. It’s a great fit for quality assurance teams, project managers, or anyone else who needs to dissect a problem systematically.
With this tool in hand, you can facilitate more effective discussions and solutions. For just $0.99, you can instantly download this editable Fishbone Diagram slide, ready to use in PowerPoint or Google Slides. Customizing the content to fit your specific needs is quick and easy, so you can start addressing those challenges within minutes.
$0.99 – Purchase Checkout
Added to cart







