SlideSwift
By Category
💼Business 📊Infographics □Minimal 🕐Timelines ✨Neumorphic 🗑Diagrams 🔄Flow Charts ✨Glassmorphism 🎨Creative 🌍Abstract 🔄Cycle Diagrams 💎Isometric 🖼Illustrations 📱Social Media 🗺MapsBy Slide Type
🚀Pitch Deck 📌Roadmap 🔍SWOT Analysis 📅Timeline 📈Gantt Chart 🏢Org Chart 📋Funnel ⚖Comparison 📄Case Study 📋Agenda ⭐Icons & Lists 👏Thank You
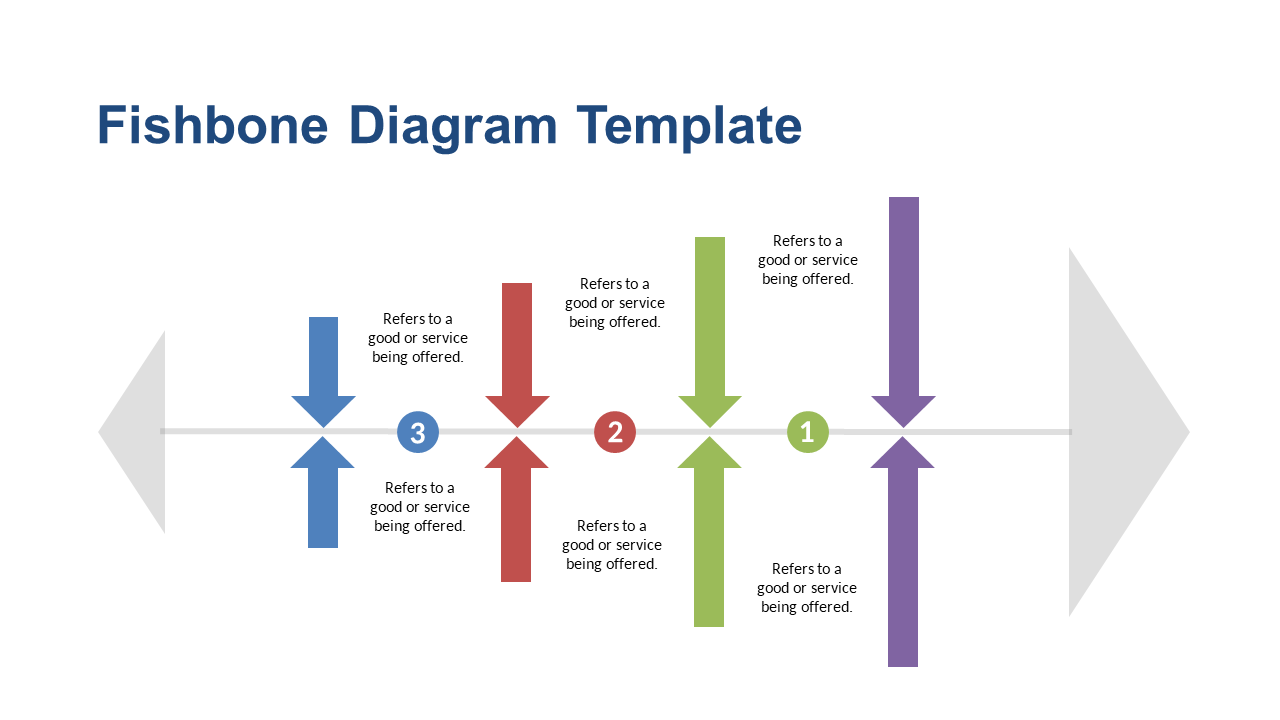
Identifying root causes can be a complex challenge, especially when multiple factors are at play. This fishbone diagram slide provides a clear visual structure that helps your team dissect problems into manageable parts. With labeled sections for various categories, this diagram allows you to pinpoint specific causes contributing to an issue. Consultants can use this slide in client meetings to facilitate discussions around challenges and solutions. Operations managers will appreciate how this layout organizes information, making it easier to implement corrective actions. Business analysts can rely on this diagram to present data-driven insights, ensuring stakeholders understand the underlying issues at hand. Easily customize the sections to fit your unique analysis needs, tailoring it to any project or presentation. Whether you need to clarify a single issue or investigate multiple factors, this slide is ready to enhance your presentation. $0.99 — add this single slide to any deck from the SlideSwift Slide Library. No subscription needed. Mix slides from any category to build your perfect deck.
Add more from this category to your custom deck