Analyze Food Marketing with a Fishbone Diagram
Product Description
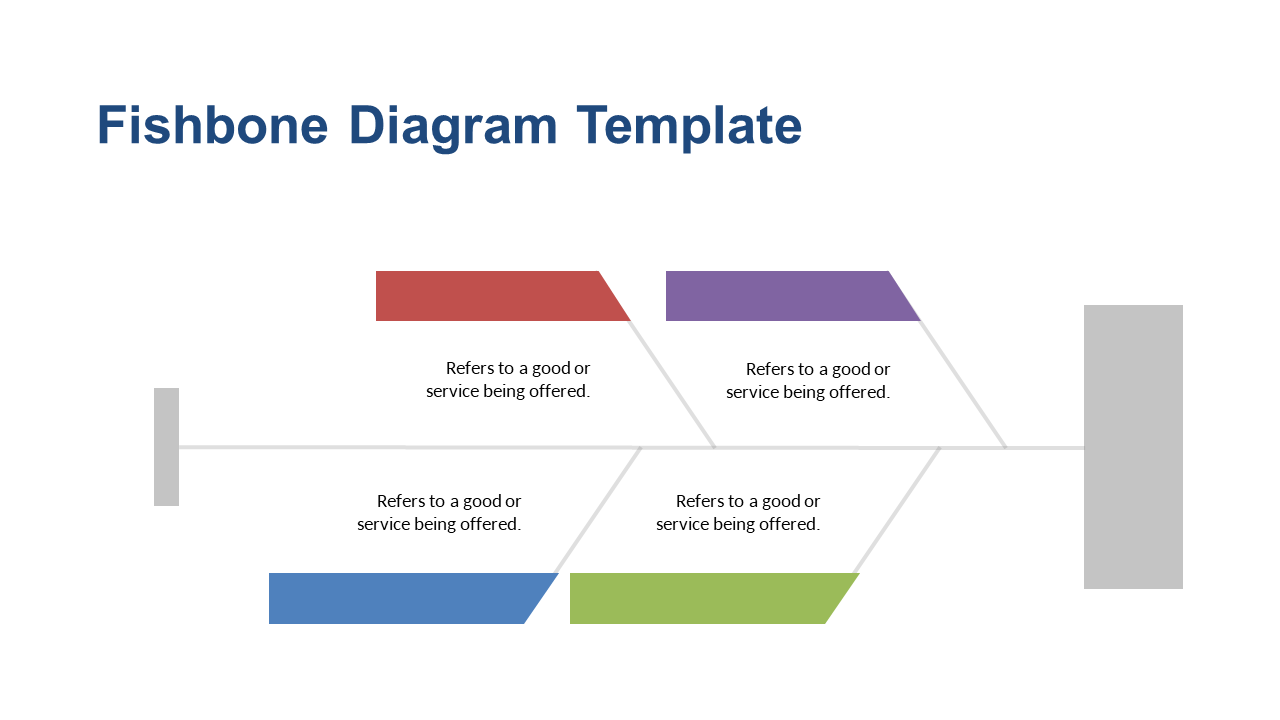
Identifying issues and their root causes in food marketing can often feel like finding a needle in a haystack. This Fishbone Diagram slide provides a clear, visual way to outline complex problems, making it simpler to pinpoint what’s really going on.
Brand managers, quality assurance teams, and marketing analysts can use this slide in problem-solving sessions, strategy discussions, or performance reviews. It allows for a structured approach to dissecting issues, helping your team collaboratively identify and address challenges.
Download this effective diagram for just $0.99, and
easily customize it in PowerPoint or Google Slides. You’ll be well-equipped to tackle your marketing analysis in no time!
$0.99 – Purchase Checkout
Added to cart