Identify Causes with Fishbone Diagram Template Style
Product Description
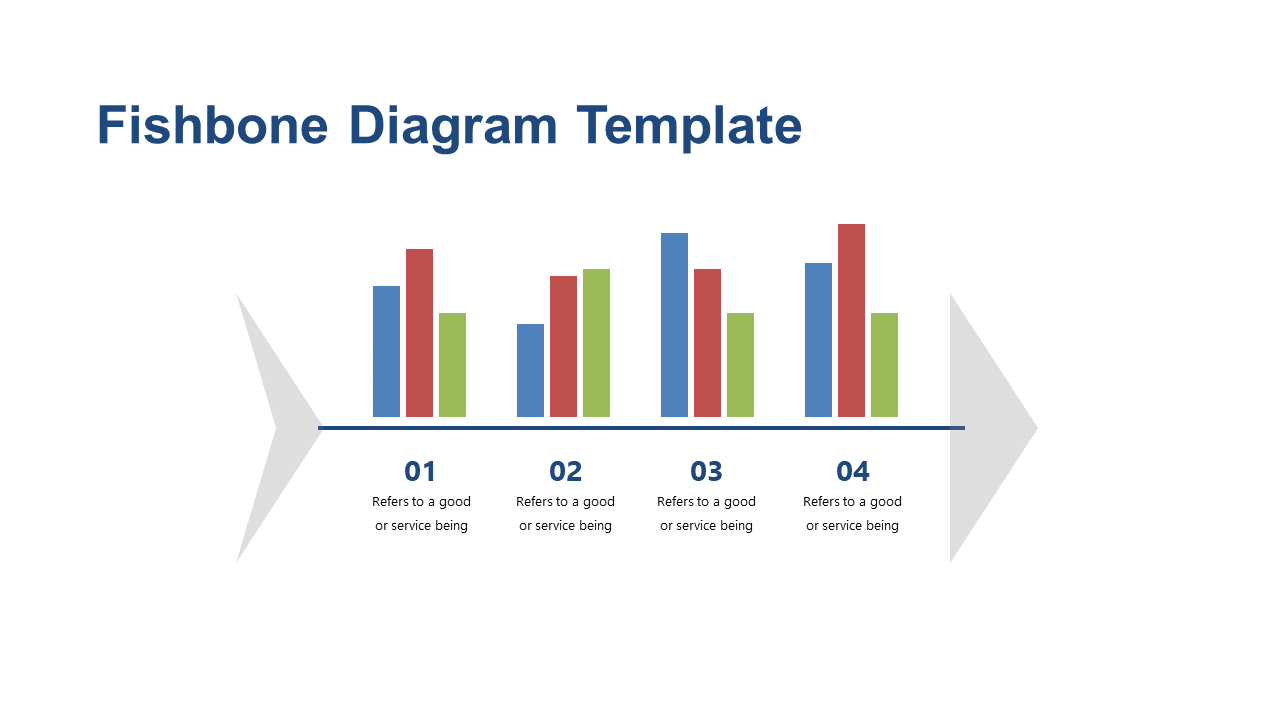
When time is of the essence, figuring out the root causes of problems can be a significant challenge. This Fishbone Diagram slide offers a visually engaging way to display and categorize potential causes, making it easier for you to present your findings clearly and logically.
Consultants, business analysts, and team leads in project management or product development can use this slide effectively during review sessions or strategy meetings. The clear layout helps facilitate discussions, enabling your team to brainstorm solutions without getting lost in the details.
For just $0.99, this editable Fishbone Diagram slide is available for instant download.
You can customize it easily in PowerPoint or Google Slides, allowing you to present your insights quickly and effectively.
$0.99 – Purchase Checkout
Added to cart







