Conduct Problem Analysis with Fishbone Diagram
Product Description
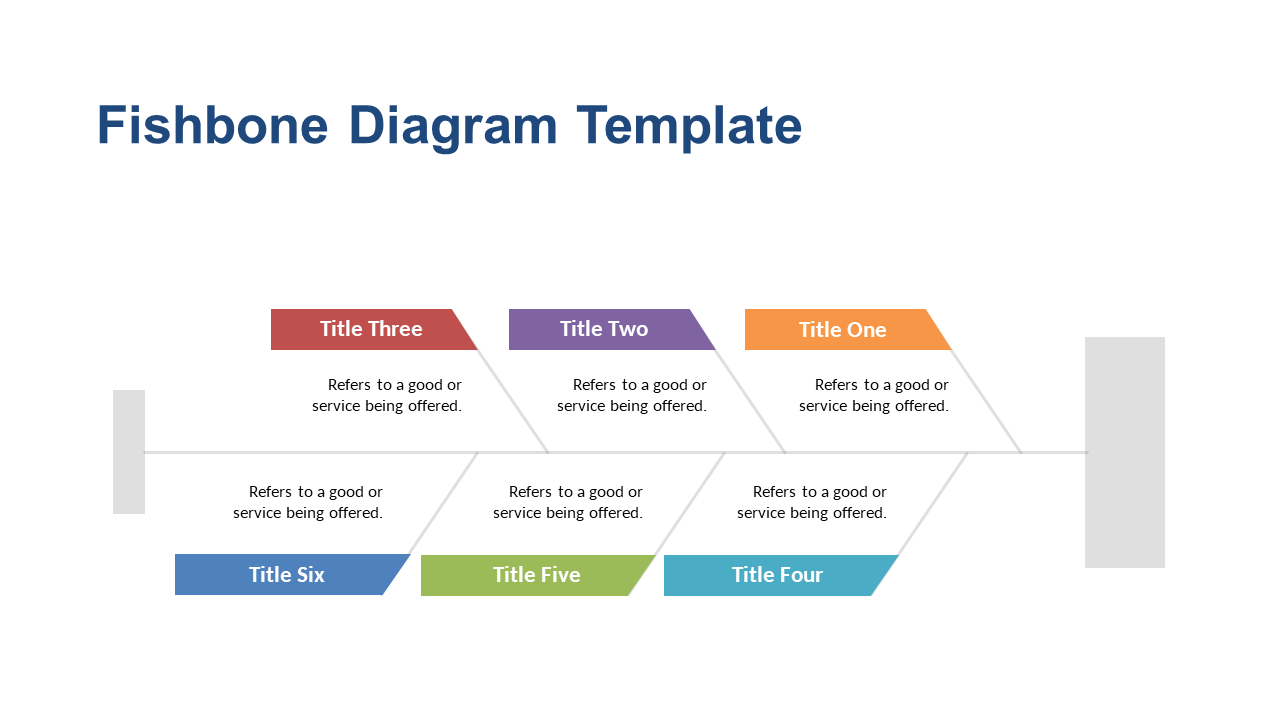
Finding the root causes of problems can be overwhelming, especially when there are many factors at play. This fishbone diagram slide helps simplify that process by providing a structured format to visualize and analyze issues.
With everything laid out clearly, you’ll be able to tackle challenges head-on instead of becoming bogged down. This slide is perfect for quality assurance specialists conducting root cause analysis or business analysts preparing reports on operational efficiencies. It can also serve engineers working on product development, allowing teams to identify factors that impact performance in a collaborative way.
For just $0.99, you can instantly download this slide and start using it right away. It’s easy to edit in both PowerPoint and Google Slides, so you can tailor it to your specific scenario with minimal effort.
$0.99 – Purchase Checkout
Added to cart







