Analyze Causes with Fishbone Diagram Template Style
Product Description
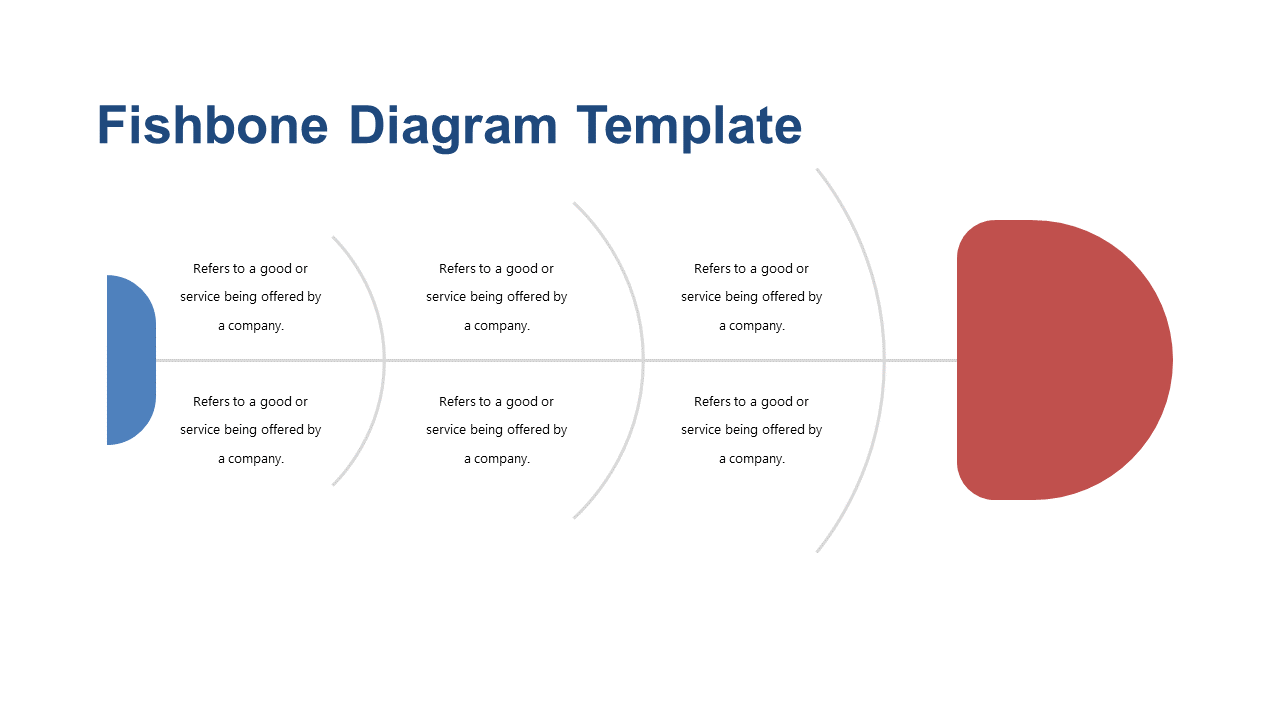
Complex problems can feel daunting, especially when trying to pinpoint the exact cause of an issue. This Fishbone Diagram slide offers a structured approach to breaking down problems into clear categories, allowing you to visualize connections between causes and effects without feeling overwhelmed.
Its clean design helps streamline your analysis efforts. Quality assurance professionals, project managers, and team leaders will find this slide invaluable when conducting performance reviews or problem-solving sessions. It encourages collaboration among team members, giving everyone a chance to contribute insights and work together towards effective solutions.
For just $0.99, you can download this slide immediately and edit it in PowerPoint or Google Slides with ease. It’s designed for quick customization, so you can get back to focusing on your project in no time.
$0.99 – Purchase Checkout
Added to cart







