Impactful Cause and Effect Analysis with Fishbone Diagram
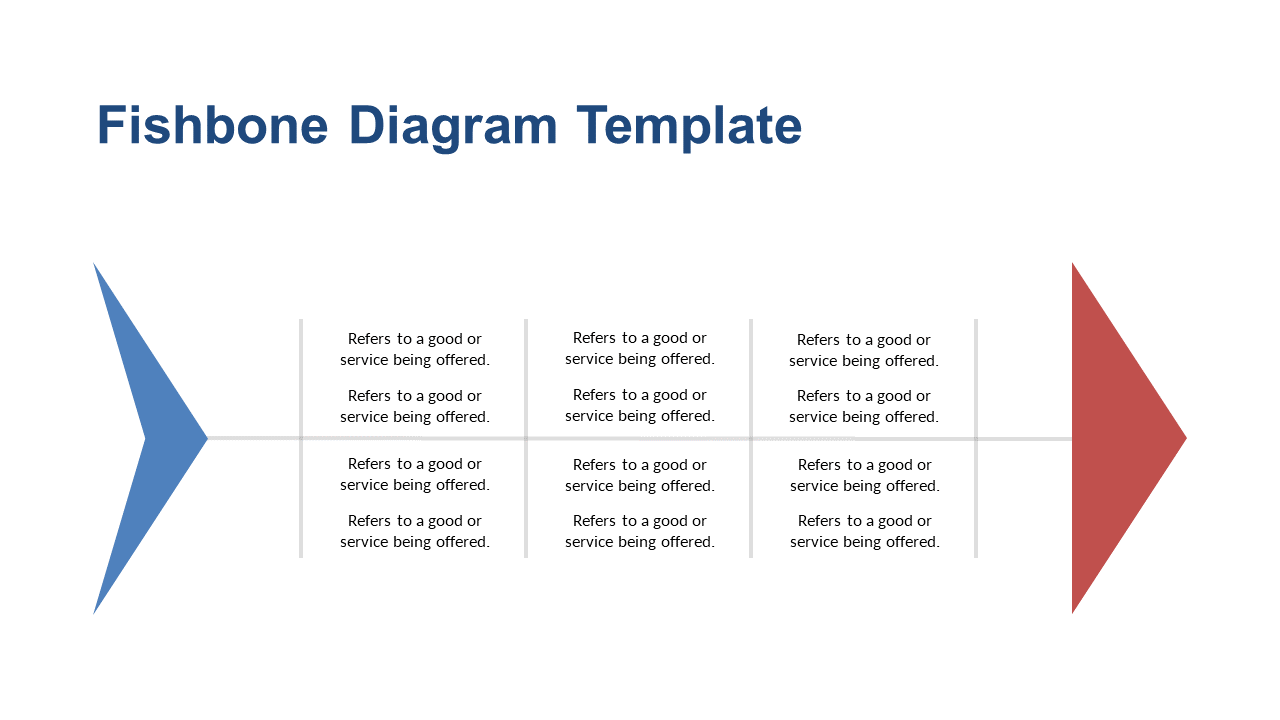
Product Description
Complex issues often lead to chaotic explanations, making it tough to pinpoint causes and effects. You need a visual aid that simplifies your analysis, transforming overwhelming data into digestible information.
This Fishbone Diagram slide offers a clear layout that’s perfect for breaking down intricate problems into manageable parts. You can use this slide in various scenarios, whether you’re a project manager leading a retrospective meeting, a team leader discussing project challenges, or a consultant presenting findings to clients. It’s especially useful in industries like manufacturing, healthcare, or software development where cause and effect relationships are critical.
At just $0.99, this slide is ready for instant download. It’s fully editable in PowerPoint and Google Slides, allowing you to customize it in mere minutes for your specific needs.
$0.99 – Purchase Checkout
Added to cart







