Conduct Analysis with Fishbone Diagram Layout
Product Description
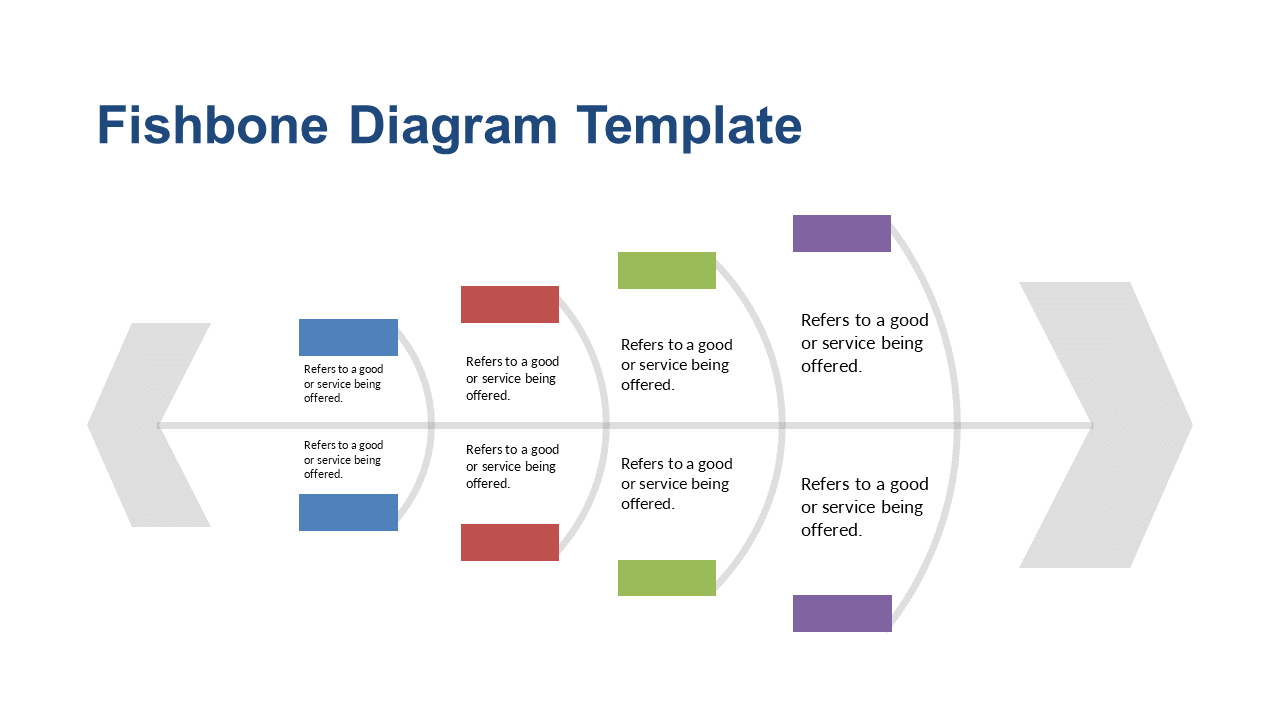
When challenges arise, pinpointing their origins can feel like searching for a needle in a haystack. The Fishbone Diagram slide provides a structured layout that helps break down problems and identify contributing factors clearly.
This clarity is essential for effective analysis and solution development. This slide is perfect for quality assurance managers and consultants who need to conduct root cause analyses in meetings or workshops. Whether you’re tackling production issues in manufacturing or service delivery challenges in hospitality, this tool enables you to dissect complex problems effectively.
For just $0.99, you can download this slide instantly and edit it in PowerPoint or Google Slides. It’s designed for easy customization, allowing you to focus on resolving issues quickly and effectively.
$0.99 – Purchase Checkout
Added to cart







