Enhance Analysis with Fishbone Diagram V2
Product Description
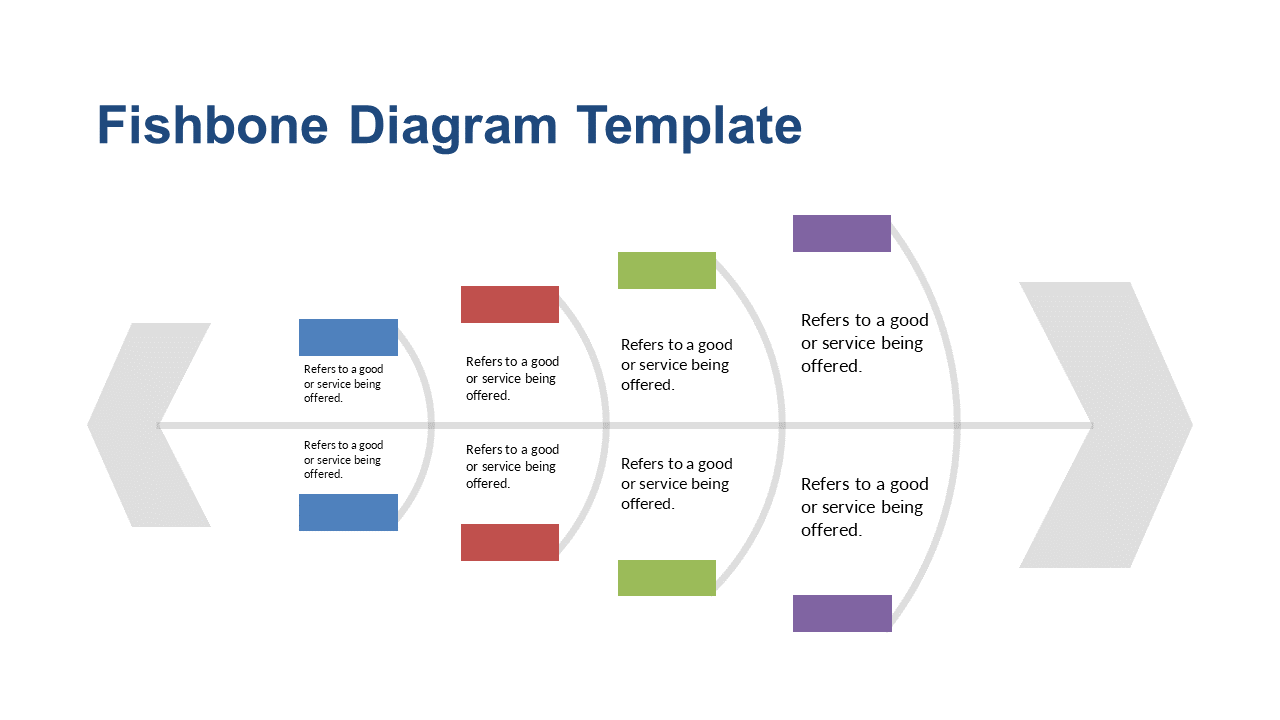
Complex problems can leave teams feeling overwhelmed and unsure of where to begin. A Fishbone Diagram helps clarify these intricate issues by visually breaking down the various factors at play, allowing you to focus on what truly matters.
This slide is perfect for ensuring your analysis is straightforward and easy to follow. This layout is ideal for project managers in tech who need to analyze software bugs, or for quality assurance teams identifying production issues in manufacturing. Whether you’re in a brainstorming session or conducting a formal review, this Fishbone Diagram will help present your findings clearly and effectively.
For just $0.99, you can download this slide, ready for immediate use. It’s easily editable in PowerPoint and Google Slides, making it simple to customize for your specific needs.
$0.99 – Purchase Checkout
Added to cart







