SlideSwift
By Category
💼Business 📊Infographics □Minimal 🕐Timelines ✨Neumorphic 🗑Diagrams 🔄Flow Charts ✨Glassmorphism 🎨Creative 🌍Abstract 🔄Cycle Diagrams 💎Isometric 🖼Illustrations 📱Social Media 🗺MapsBy Slide Type
🚀Pitch Deck 📌Roadmap 🔍SWOT Analysis 📅Timeline 📈Gantt Chart 🏢Org Chart 📋Funnel ⚖Comparison 📄Case Study 📋Agenda ⭐Icons & Lists 👏Thank You
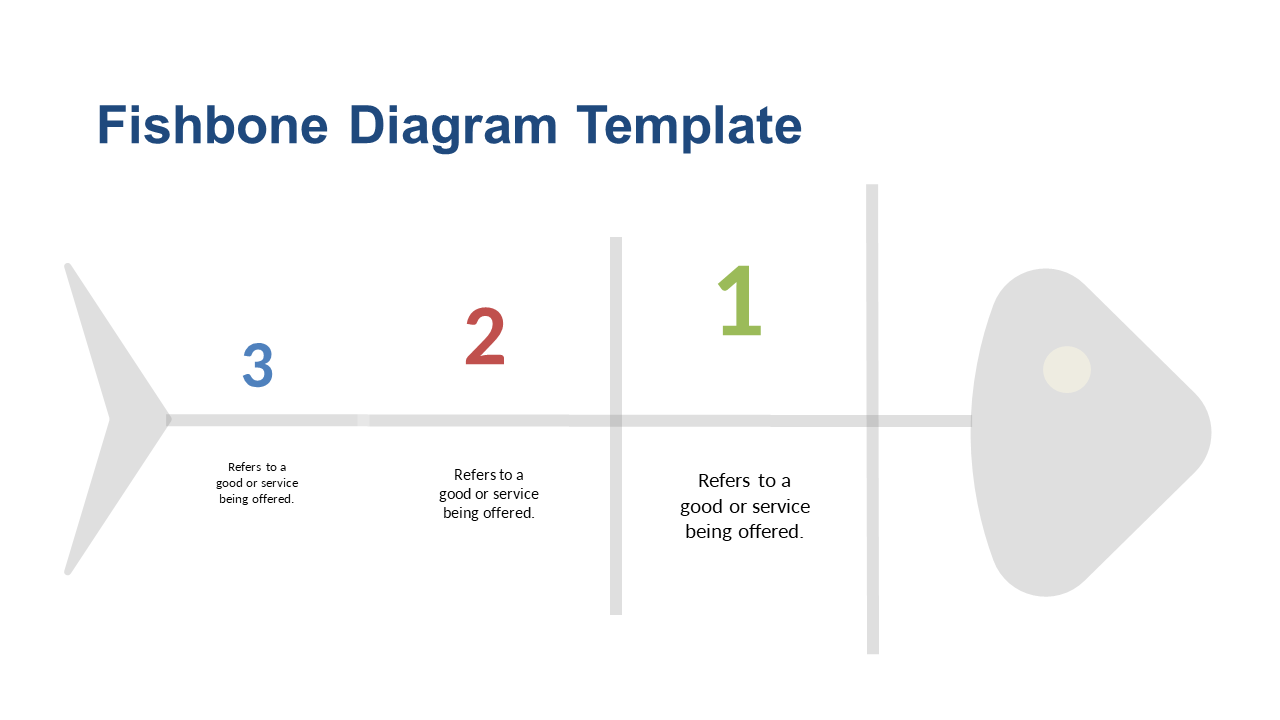
When tackling complex issues, a structured approach can make all the difference. The Fishbone Diagram offers a straightforward way to visualize potential causes of a problem, allowing teams to dissect issues with clarity. This slide presents a clean design with a central spine branching out to various categories, making it easy to identify root causes. As a business analyst, use this slide in your next stakeholder meeting to illustrate problem areas and facilitate discussions. For architects, this diagram can help in analyzing design flaws or inefficiencies in projects, providing a visual avenue to address specific concerns. Consultants can leverage this slide during workshops to guide clients through problem-solving sessions, ensuring everyone is aligned on the issues at hand. Customizing the categories or causes on this slide is simple, allowing you to tailor it to any specific project or client need. $0.99 — add this single slide to any deck from the SlideSwift Slide Library. No subscription needed. Mix slides from any category to build your perfect deck.
Add more from this category to your custom deck