SlideSwift
By Category
💼Business 📊Infographics □Minimal 🕐Timelines ✨Neumorphic 🗑Diagrams 🔄Flow Charts ✨Glassmorphism 🎨Creative 🌍Abstract 🔄Cycle Diagrams 💎Isometric 🖼Illustrations 📱Social Media 🗺MapsBy Slide Type
🚀Pitch Deck 📌Roadmap 🔍SWOT Analysis 📅Timeline 📈Gantt Chart 🏢Org Chart 📋Funnel ⚖Comparison 📄Case Study 📋Agenda ⭐Icons & Lists 👏Thank You
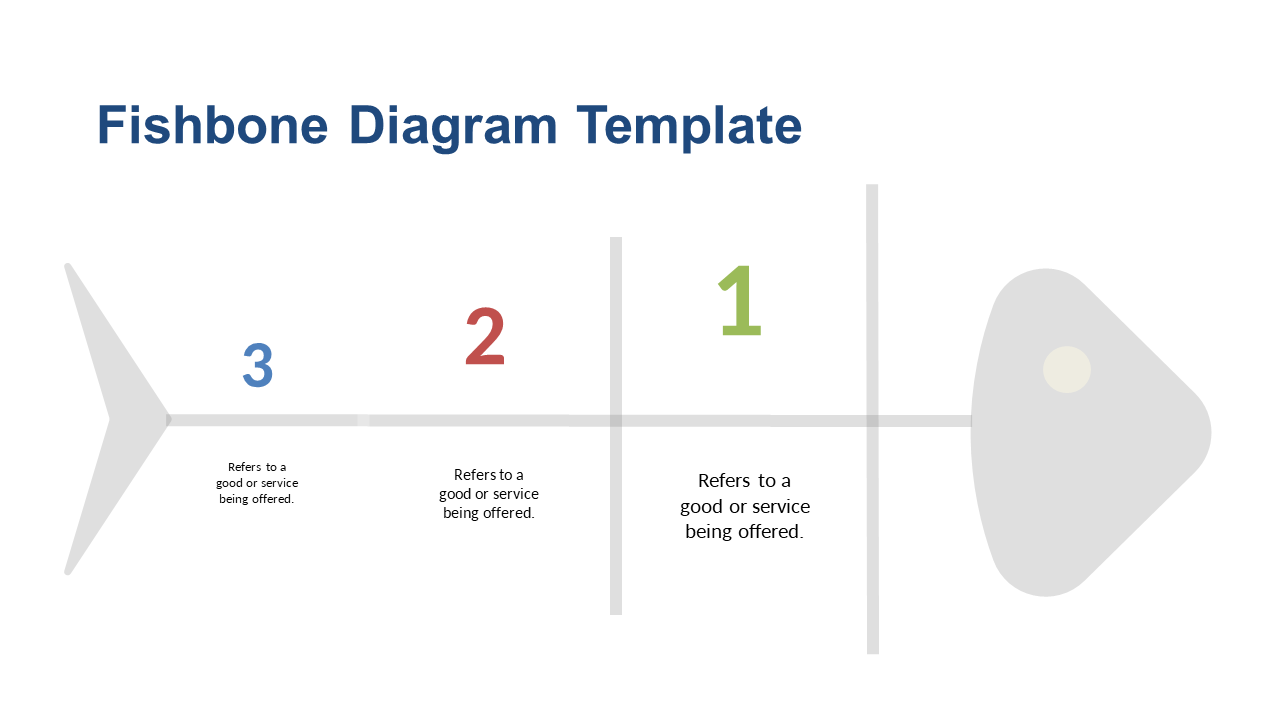
When faced with complex problems, operations managers need a clear way to identify root causes that hinder progress. This Fishbone Diagram is designed to visually map out potential causes, making it an essential tool for effective problem-solving. The slide presents a central spine branching out into various categories of causes, helping teams pinpoint specific issues. For operations managers, this diagram can streamline discussions in team meetings, allowing for focused brainstorming on solutions. Business analysts will find this slide useful for presenting data insights, showcasing how different factors contribute to project challenges. Architects can leverage this diagram to illustrate design flaws or inefficiencies, guiding project stakeholders toward informed decisions. Customizing the categories to fit your specific context is simple, allowing for tailored presentations that resonate with your audience. $0.99 — add this single slide to any deck from the SlideSwift Slide Library. No subscription needed. Mix slides from any category to build your perfect deck.
Add more from this category to your custom deck