Analyze Market Awareness and Desire in Europe

Product Description
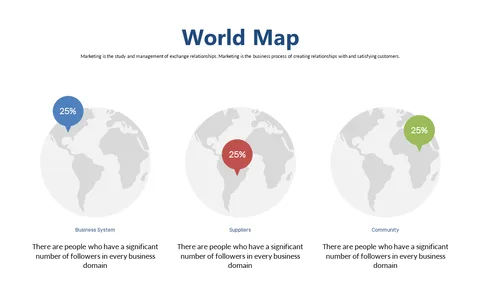
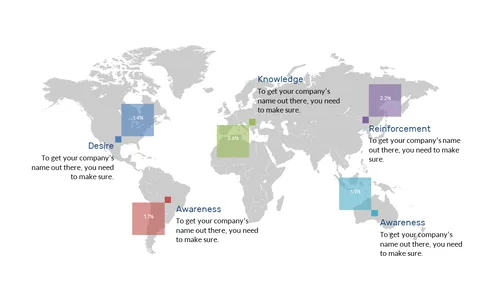
Grasping the nuances of market awareness and desire across different regions can be tricky, especially when dealing with a diverse continent like Europe. This slide simplifies that challenge by providing a clear visual of varying sentiment levels, helping you convey critical insights in a straightforward manner that resonates with your audience.
Market researchers, brand managers, and business development teams aiming to understand customer perceptions will find this slide invaluable during presentations or strategy sessions. Whether you’re showcasing findings to stakeholders or using it in internal discussions, the visual clarity helps ensure everyone is on the same page regarding market dynamics.
For only $0.99, this slide can be yours with an instant download that’s ready for editing. It’s compatible with both PowerPoint and Google Slides, making it easy to adjust and personalize your data presentation with minimal effort.
$0.99 – Purchase Checkout
Added to cart