Show Regional Data Insights with Europe Map
Product Description
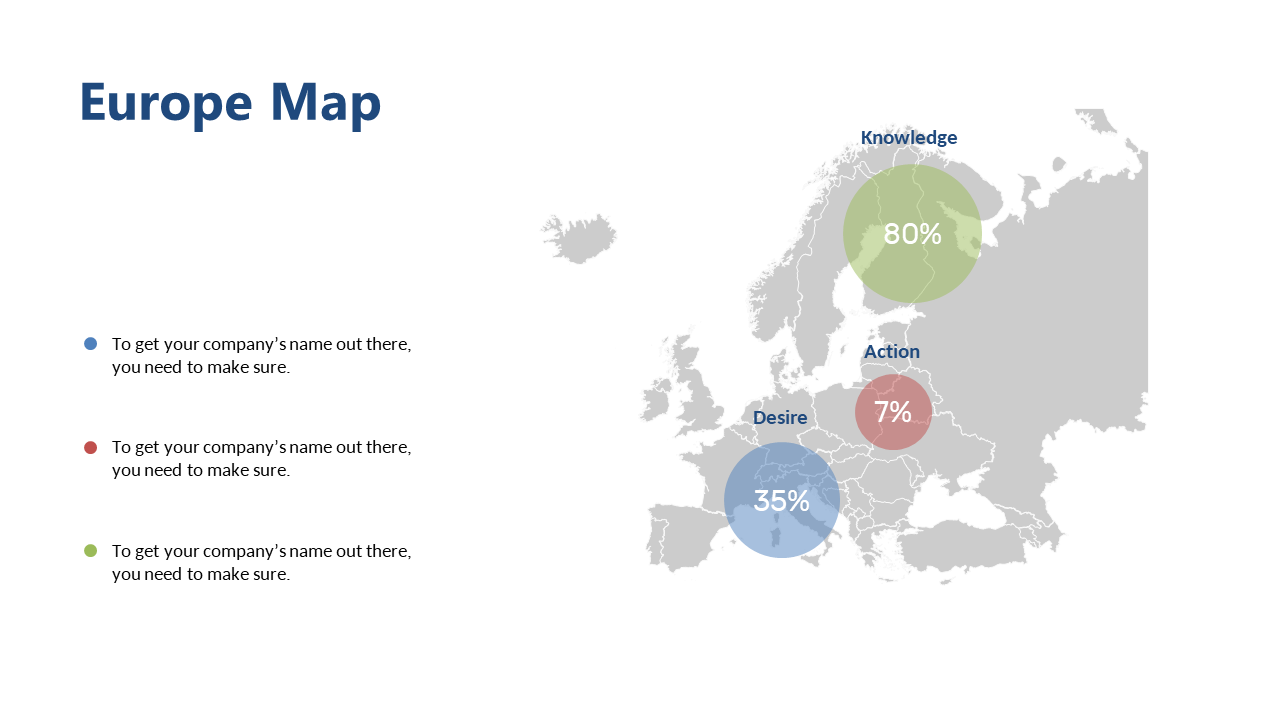
Presenting complex regional data in a digestible format can feel like a daunting task. With this Europe map slide, you can turn intricate metrics into a visually appealing representation that makes it easy for your audience to understand knowledge, action, and desire across different regions.
It’s designed to remove confusion and make your insights clear. This slide is perfect for consultants and analysts working in industries such as marketing, sales, or logistics during client presentations and strategic planning meetings. If you’re in a role focused on regional market assessments, this visual tool will assist you in effectively communicating your findings and recommendations to your clients or team members.
For just $0.99, you can download this slide instantly and start customizing it right away. It’s fully editable in PowerPoint and Google Slides, which means you can tailor it to fit your specific needs in just a few minutes.
$0.99 – Purchase Checkout
Added to cart







