Showcase Digital Marketing Stats in PowerPoint
Product Description
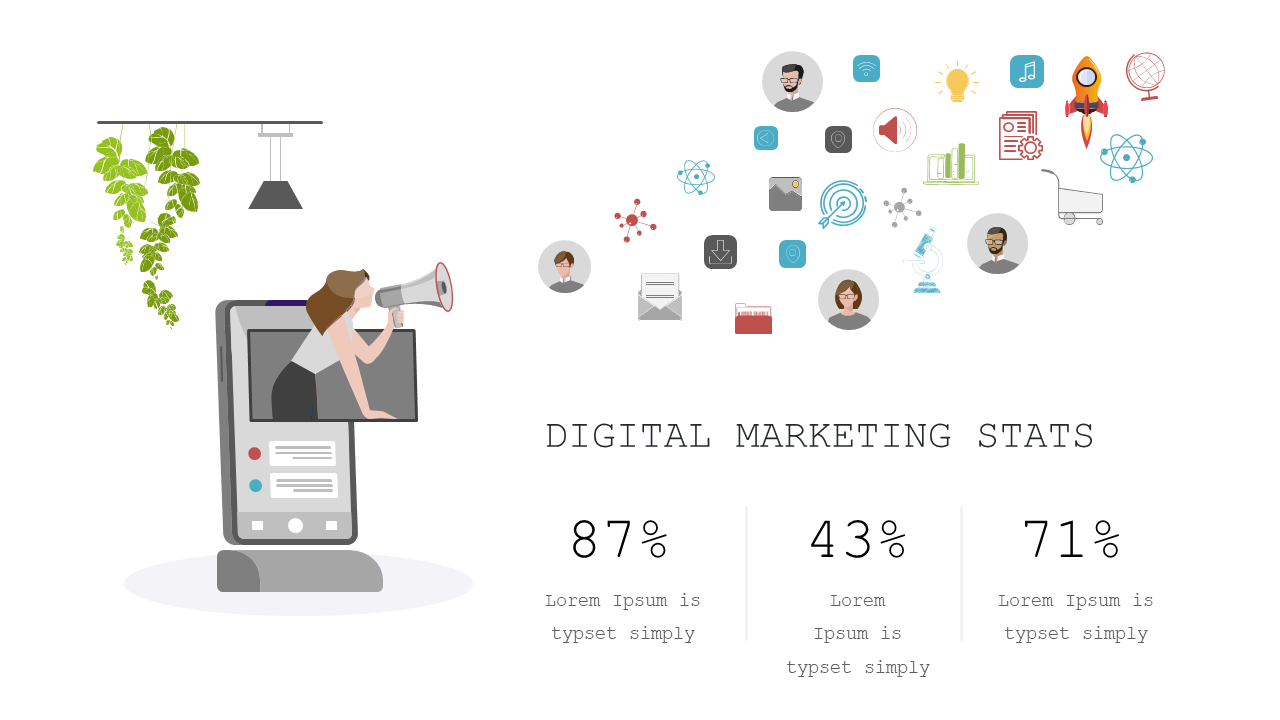
In the fast-moving landscape of digital marketing, presenting stats in an engaging way is crucial for capturing attention. This slide provides a dynamic layout that showcases essential marketing data, making your findings visually appealing and easy to digest.
Digital marketers, business analysts reporting on campaign performance, or entrepreneurs pitching their strategies will find this slide to be a game-changer. Use it in team meetings, client presentations, or any situation where you need to communicate important marketing statistics effectively.
For just $0.99, this slide is ready for instant download and completely editable in PowerPoint and Google Slides. Elevate your presentations with visuals that speak volumes in minutes.
$0.99 – Purchase Checkout
Added to cart







